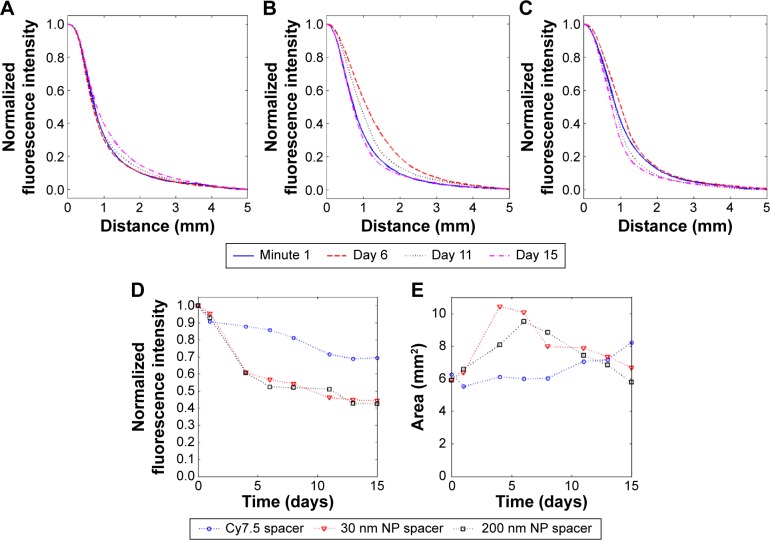
Figure 7.
Averaged fluorescence diffusion curves over all spacers imaged (N=8), normalized to the intensity at x=0 per time point.
Notes: (A) Cy7.5 dye spacers, (B) 30 nm nanoparticle spacers, and (C) 200 nm nanoparticle spacers. (D) The average maximum spacer fluorescence intensity normalized to initial time point showing the continual decrease in maximum fluorescence over time. (E) The fluorescence area imaged (full width at half maximum) around the spacer as a function of time, averaged over all trials. As indicated, diffusion occurred continuously over time, with the maximum diffusion area observed on day 4 for 30 nm NPs, day 6 for 200 nm NPs, and continuously increasing area observed for free dye.
Abbreviations: Cy7.5, Cyanine 7.5; NPs, nanoparticles.

