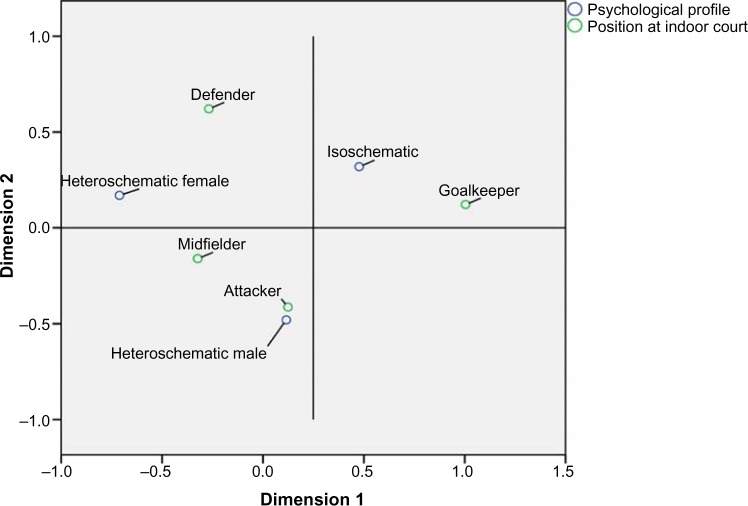
Figure 3.
Perceptual map of positions and typological groups as determined via a correspondence analysis.
Notes: Dimension 1 explains 56.0% of the inertia of the cloud, while dimension 2 explains 44%. These two dimensions are sufficient to retain the maximum possible variability (inertia). This Perceptual map displays major contributions of the model in opposition to the origin and is based on individual quadrants. In the first quadrant we observe a possible association between the pivot and wing position while the typological group is heteroschematic. In the third quadrant we can see the goalkeeper with an isoschematic configuration and in the fourth quadrant the athlete standing with the female is heteroschematic in configuration. The chi-square test at a confidence level of 95% was used to determine whether associations existed between court positions and typological groups. The test found no predominance of any typological group in terms of specific player positions (P=0.60). Nevertheless, we can see that there is a higher correlation with the heteroschematic male attackers – the closer the typological group is on the court position, the greater the correlation between them.

