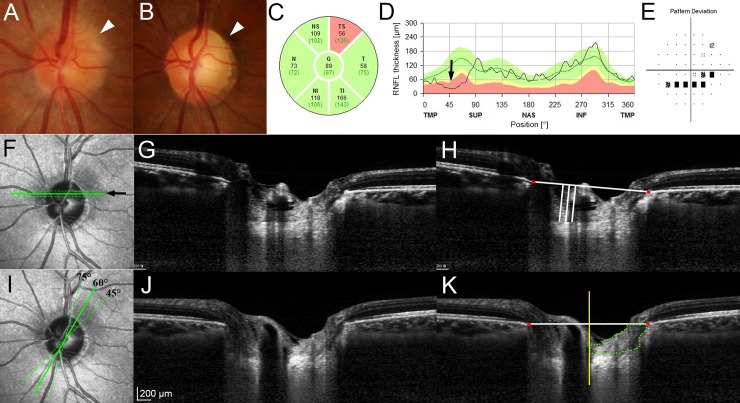
Fig 1. Measurement of the anterior lamina cribrosa surface depth (LCD) and the prelaminar tissue (PT) thickness (PTT) in the sector of interest.
(A) Disc photograph obtained at the onset of nonarteritic anterior ischemic optic neuropathy (NAION). Note the blurred disc margin in the superotemporal sector (arrowhead). (B) Pallor is evident at the superotemporal neuroretinal rim 6 months later (arrowhead). Circular diagram (C) and TSNIT (temporal–superior–nasal–inferior–temporal) retinal nerve fiber layer (RNFL) thickness profile (D) at the 6-month follow-up. The superotemporal RNFL is thinner (arrow). (E) Inferior arcuate scotoma corresponding to the RNFL loss is evident. (F) Location of the three equidistant horizontal B-scans obtained from the middle third of the affected hemi optic nerve head (solid and dotted lines). (G) Horizontal B-scan image obtained from the location indicated by the arrow in the image on the left (F; solid line). (H) Same image shown in the image on the left (G) with labels. The LCD was measured as the perpendicular distance from the horizontal reference line (horizontal line) connecting the two terminations of Bruch’s membrane opening (BMO) (red glyphs) to the anterior laminar surface at three points: the maximally depressed point and two additional points that were 100 and 200 μm from the maximally depressed point in the temporal direction (vertical lines). (I) Location where the PTT was measured on three radial B-scans obtained from the affected sector (solid and dotted lines). (J) Radial B-scan image obtained from the 60-degree meridian shown in the image on the left (I; solid line). (K) The same image shown in the image on the left (J) with labeling. The PTT was measured by delineating the area surrounded by the vertical reference line (yellow line) from the center of BMO, anterior LC border, border tissue of Elschnig on the temporal side, the horizontal reference line connecting each BMO at the neuroretinal rim, and the internal limiting membrane (the area demarcated by dotted line). The average PTT was calculated by dividing the PT area by half of the BMO distance.

