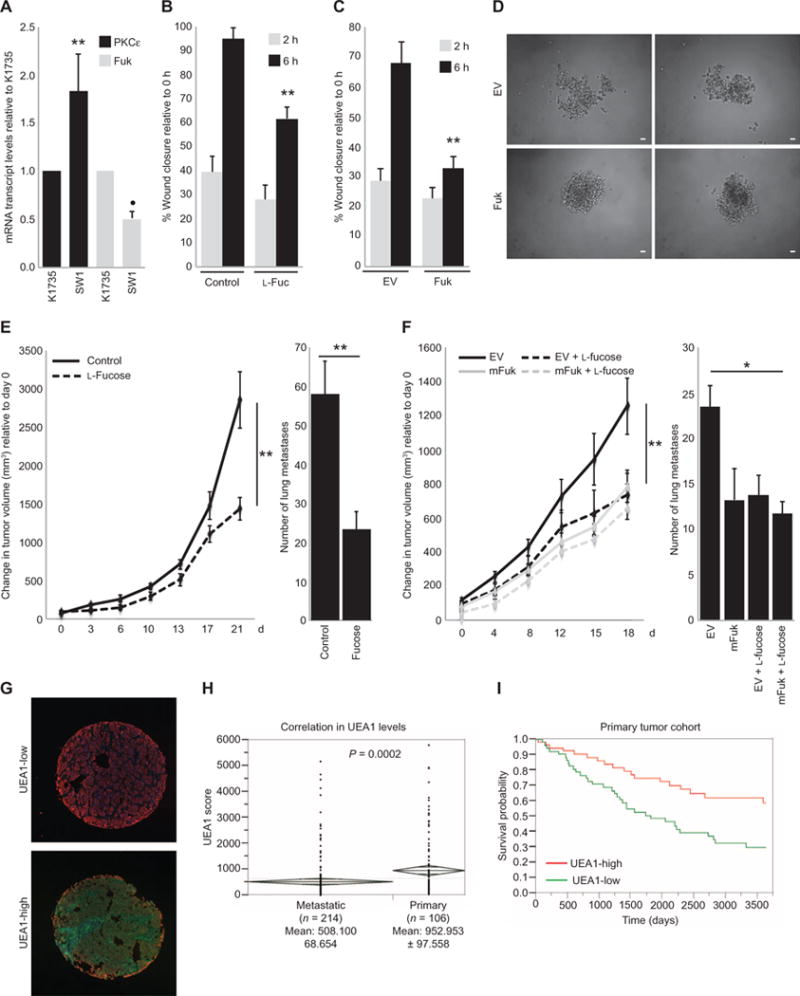
Fig. 3. Increased FUK expression attenuates melanoma development and metastasis and correlates with increased survival in human patient samples.

(A) qRT-PCR analysis of PKCε and mFuk expression in SW1 and K1735 cells. (B and C) Scratch assays assessing the migration of SW1 cells (B) in which cultures were supplemented with control water (Control; 5 μl) or L-fucose (L-Fuc; 50 μM) for 36 hours or (C) in which cells were transfected with EV or mFuk. (D) Two representative spheroids (n = 3 experiments) formed by EV- or FUK-expressing SW1 cells in culture. Scale bars, 10 μm. (E and F) Tumor volume curves (left) and lung metastasis counts (right) of (E) C3H/HeJ mice bearing implanted SW1 tumors or (F) mice bearing implanted EV-or mFuk-expressing SW1 tumors provided with control water (Control) or water supplemented with L-fucose (Fucose,100mM).Data are means ± SD from six mice per group. (G) Representative UEA1-low (upper) and UEA1-high (lower) histospots from a human melanoma TMA (n = 320) immunostained with UEA1 lectin (green), S100/HMB45 (red), and 4′,6-diamidino-2-phenylindole (DAPI, blue). (H) Distribution of UEA1 scores within S100/HMB45-positive melanoma cells of individual histospots from primary or metastatic melanoma samples. Means, SD, and n as indicated; P = 0.0002 by unpaired t test. Diamonds depict means ± 1 SD. (I) Kaplan-Meier survival curves according to UEA1 abundance in a melanoma patient cohort. Data in (A) to (C) are means ± SD from three experiments. *P < 0.05, **P < 0.005 by a standard t test compared with parental K1735 cell lines, controls, or starting time point.
