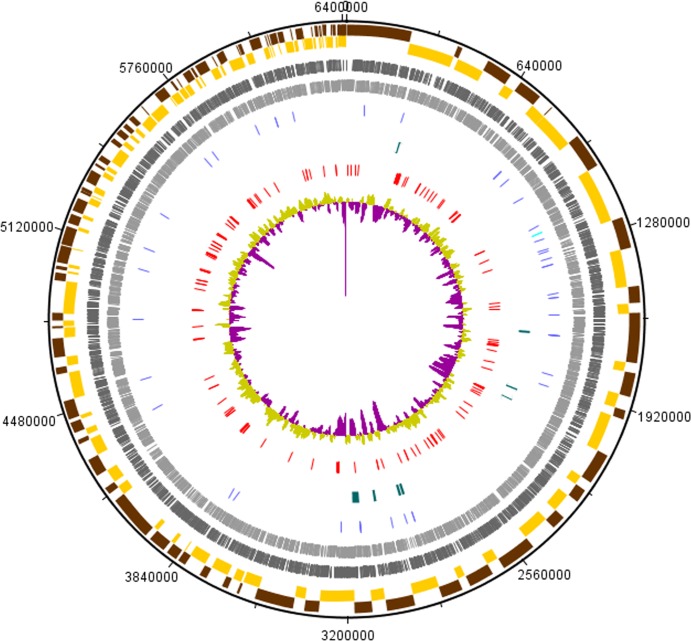
Fig 1. Circular representation of UM_CSW genome.
The indication for each feature from the outermost layer: (a) The alternating brown and yellow coloured bars represent the odd and even numbered contigs respectively; (b) The dark and light grey coloured bars represent the protein-coding genes in the forward and the reverse strands respectively; (c) rRNAs (light blue) and tRNAs (dark blue); (d) genomic islands (green); (e) virulence genes (red); (f) GC plot (purple and light green).

