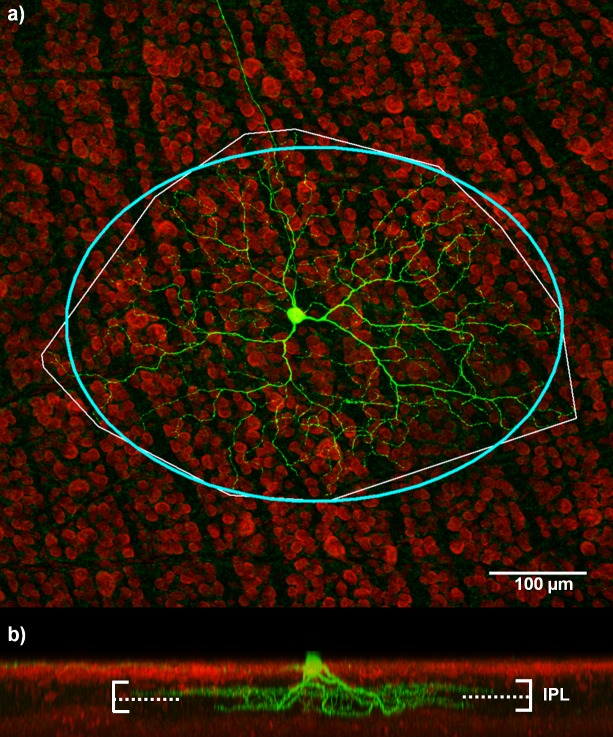
Fig 4. ON-OFF retinal ganglion cell.
(a) A stained image of a RGC from which dendritic stratification and dendritic field size can be analyzed. The bounding box (thin white line) shows the region encompassing the dendritic field of the cell. An ellipse was fit to this region (thick blue line) to estimate the dendritic field size. The major axis of the elliptical fit for this cell was 508 μm. (b) Dendritic stratification for this cell is in two distinct layers of the inner-plexiform layer (IPL). Dendrites in the ON sublamina of the IPL stratify at an average depth of 66.9%, while the OFF dendrites stratify at an average depth of 27.2%. The solid horizontal lines represent the edge of the IPL. The dashed line represents the approximate ON/OFF border; the region above the dashed line is the ON layer, the region below is the OFF layer.

