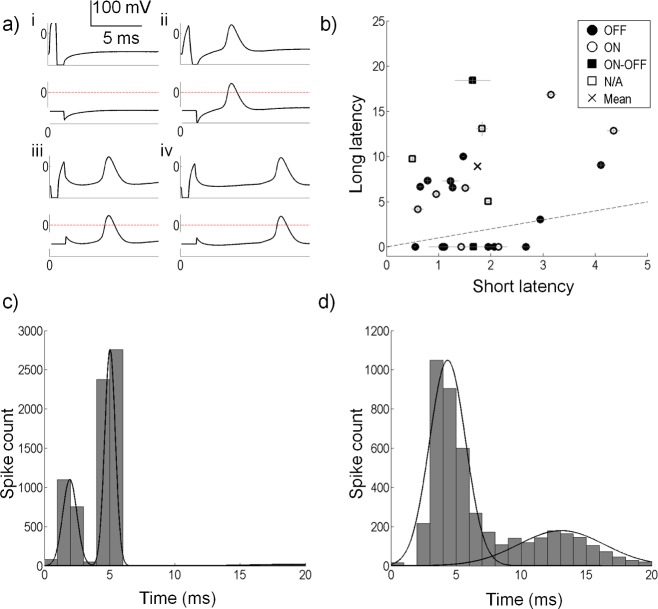
Fig 6. Spike detection and spike latency analysis.
(a) Membrane potentials showing the response to four stimulus types; (i) a failed anodic first stimulus, (ii) a successful anodic first stimulus with a short-latency response, (iii) a successful cathodic first stimulus with a short-latency response and (iv) a successful cathodic first stimulus with a long-latency response. Bottom traces in each panel show the stimulus artefact removed by setting the artefact to a constant value, and the threshold used to detect spikes (horizontal line at zero). (b) Short and long spike latencies for all cells. Horizontal lines show the standard error of the short latency clusters. Vertical lines show the standard error for the long latency clusters. Note that for many of the cells, the standard errors are very small. The dashed line shows the line of equality. Eight cells did not produce a long latency component, and hence lie below the dashed line. The × symbol shows the mean of all short and long latencies. (c) Distribution of spike latencies for a sample cell. A k-means cluster analysis (2 clusters) on the spike latencies gives the two distributions shown by the Gaussian distribution. This cell had a short-latency distribution mean of 1.95 ms (SD 0.54 ms). The long-latency distribution mean is 5.03 ms (SD 2.58 ms). (d) Distribution of spike latencies for another sample cell. A k-means cluster analysis (2 clusters) on the spike latencies gives the two distributions shown by the Gaussian distribution. This cell had a short-latency mean of 4.35 ms (SD 1.37 ms). The long-latency distribution mean is 12.87 ms (SD 2.58 ms).

