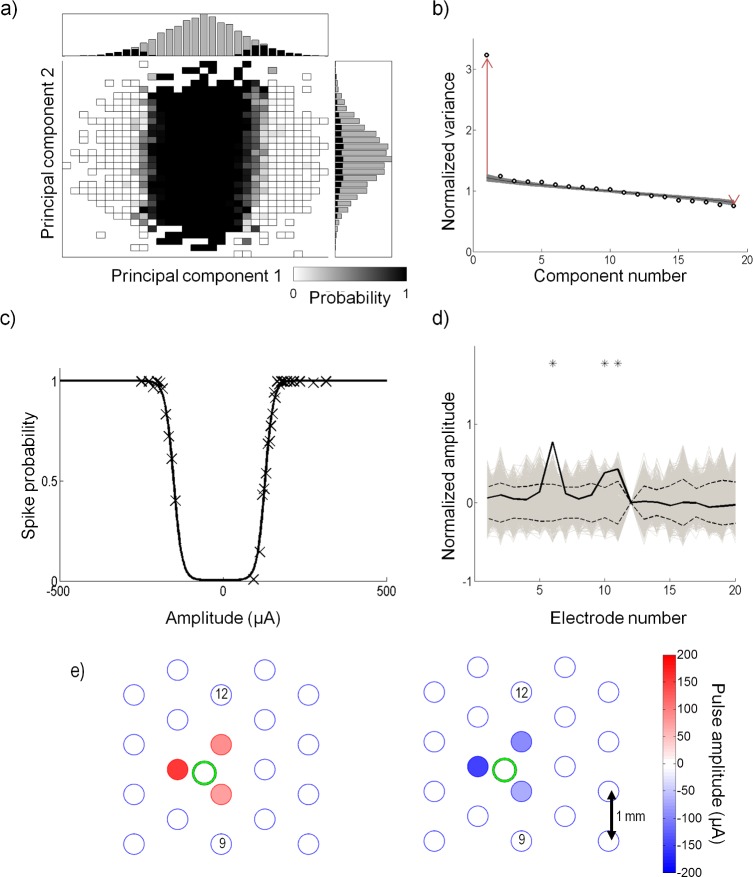
Fig 7. Recovery of model parameters for a sample cell.
(a) The stimuli are projected onto the first two principal components, and . The grey squares represent the spike probability, where a black value represents 0 probability, and a white value represents a probability of 1. Plotted above and to the right are the histograms of the stimuli (gray) and the spike-triggered stimuli (black) along each component axis. (b) Eigenvalues of the spike-triggered stimuli recovered by principal component analysis (round circles) are plotted. The eigenvalues are normalized by the variance of the input stimuli. The shaded region represents the 95% confidence interval from the statistical hypothesis test. The hypothesis test recovered one significant excitatory and one significant suppressive component. The red arrows show the distance between the two most significant eigenvalues and the mean of the random distribution recovered from the first iteration of the hypothesis test. The length of the arrows represent d1 and d2 from Eq (10). (c) The nonlinear function recovered by fitting a double sigmoid to the spike probability projected onto and . Open circles represent the raw data and the solid line shows the nonlinear equation fit (r2 = 0.98). This cell had a positive and negative threshold (parameters c+ and c− in Eq (5)) of 129 μA and -152 μA proportional to and , respectively. (d) The true and (solid black) are compared to the root mean square (dashed line) of a distribution of and (gray). Stars show which electrodes were significant. In this preparation, electrode 12 was not operational. (e) Representation of the amplitudes that generate the ERFs, (left) and (right). The large circles represent the electrode locations. A correlation coefficient of -0.97 was obtained between and . Three electrodes significantly affected the cell in and in . In this experiment, the retina was placed such that the optic disc was located around electrode 9. The stimulation return electrode was placed distally above electrode 12. The green circle shows the approximate dendritic field of the recorded cell. Stimulus amplitudes ranged up to ±300 μA; however, the range shown here is smaller to make the differences in electrode amplitudes clearer.

