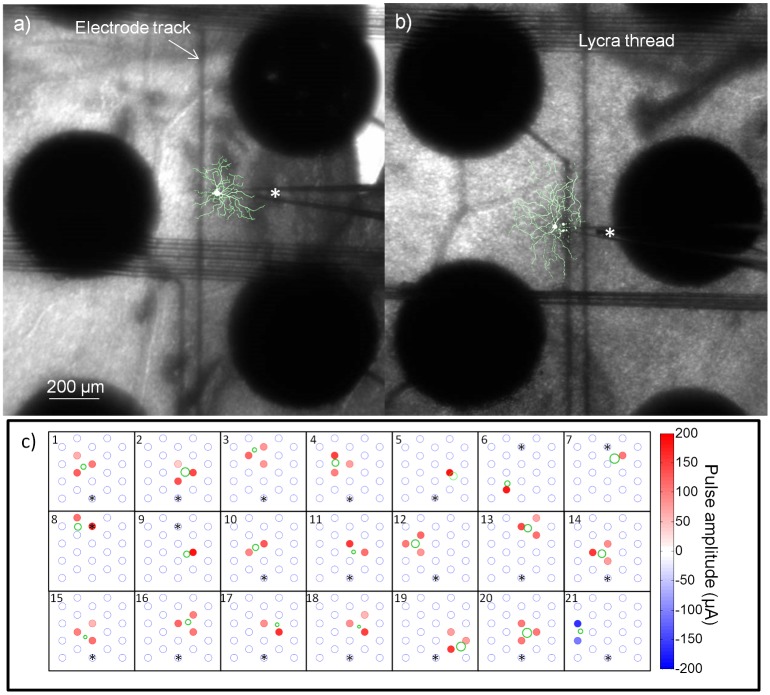
Fig 8. Dendritic and electrical receptive fields.
a-b) Sample cells depicting the stimulating array (large black discs) and the patch-clamp recording electrode (denoted by a *). Overlaid on the images are the morphological reconstructions of the cells. The sample cell in (a) is also shown in (c) 16. The sample cell in (b) is also shown in (c) 20. Note that the stimulating electrodes appear large, but the exposed area is only 400 μm. Also visible are the lycra threads used to keep the retina affixed and the stimulating electrode tracks. c) The electrical receptive fields shown together with the dendritic receptive field estimates. The electrodes with stars above them show the approximate location of the optic disc for each preparation.

