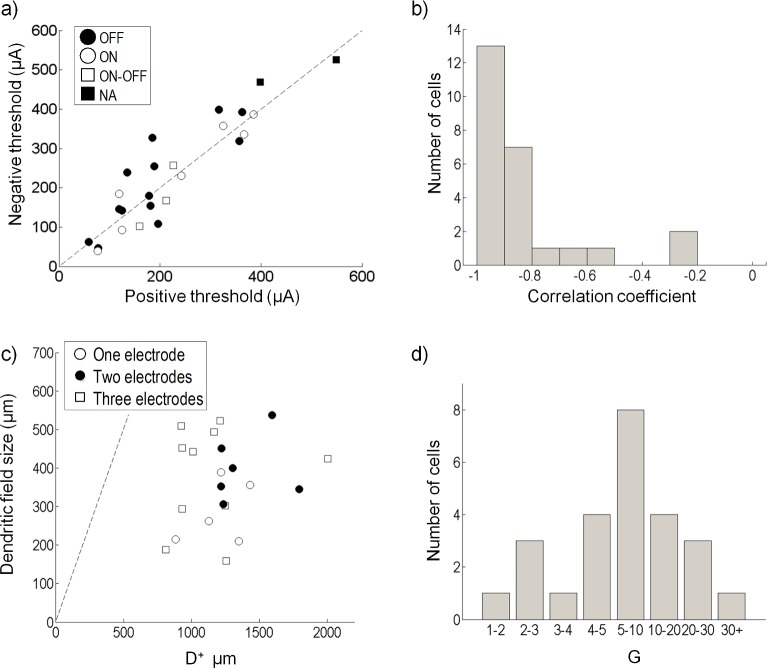
Fig 9. Population data.
(a) Threshold recovered from the nonlinear function for positive and negative regions for all cells; no significant differences were found between cell types (p > 0.3). (b) The correlation coefficients of the positive and negative electrical receptive fields ( and ). (c) Radius of electrical influence for 21 cells. Shown is the approximate range of electrical influence for anodic-first stimulation (D+) and the dendritic field size for each cell. Cells were only significantly influenced by one (open circle), two (closed circle) or three (square) electrodes in the ERF. (d) Histogram showing the value of G (Eq (10)) for all cells. 20 of the 25 cells recovered a that was 4 or more times larger than .

