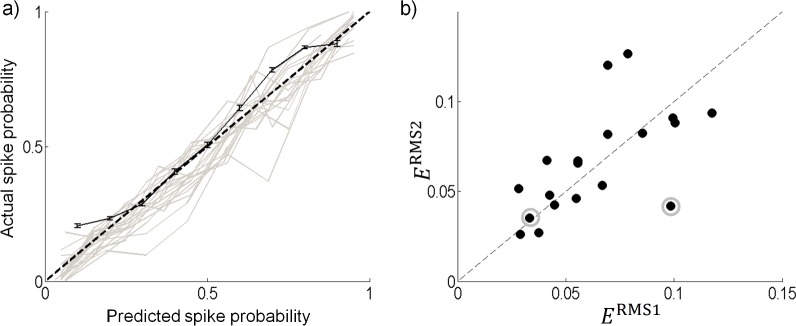
Fig 10. Model validation.
(a) The predicted probability compared to the actual probability from the validation data for all cells (gray). For clarity this data is shown without error bars. The validation of the sample cell from Fig 7 with standard error bars (black solid line) is also shown. The root mean square error for this cell was 0.056. (b) The 2-dimensional model error (ERMS2) is compared to the 1-dimensional model error (ERMS1) for all cells where the hypothesis test recovered 2 or more significant components.

