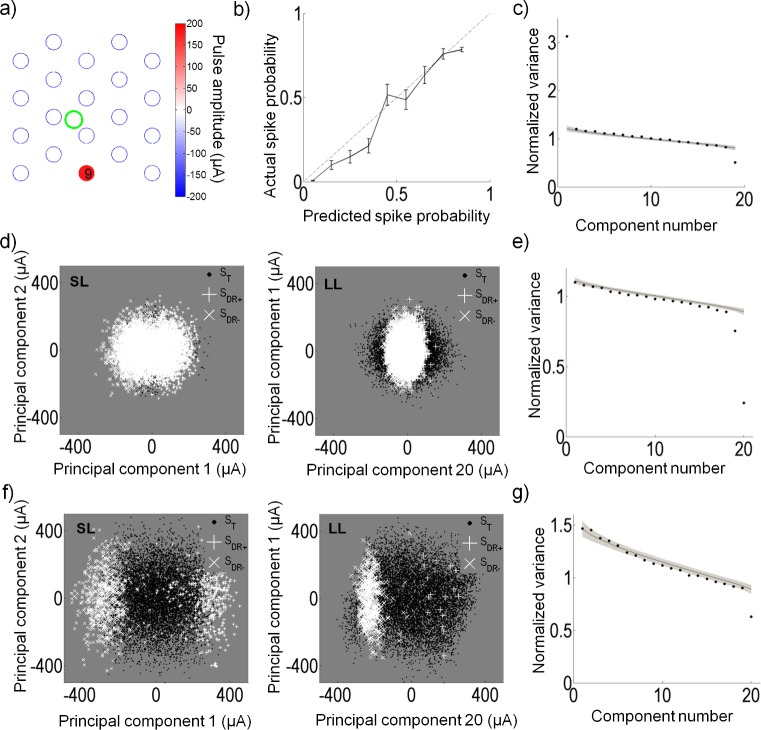
Fig 11. Model applied to long-latency responses.
(a) The positive electrical receptive field for long-latency responses of the same cell as in Fig 7. This cell is largely influenced by electrode 9, which in this preparation was below the optic disc. (b) The predicted response vs. the actual response probability for the cell in (a). The root mean square error between prediction and actual response probability was 0.07. (c) The eigenvalues of the long-latency spike-triggered stimuli with one large excitatory and suppressive component evident. (d) An example of a cell with a suppressive response for long-latency (LL) responses. This cell fired with fewer spikes when the stimulus was stronger along the first or second principal component. Also shown is the short-latency (SL) response for comparison. (e) The corresponding eigenvalues for the long-latency responses in (d). (f) An example of a cell with a preferred stimulus polarity for long-latency responses. This cell responded with a greater number of spikes when the stimulus was cathodic-first, and very few spikes when the stimulus was anodic-first. Also shown is the short-latency response for comparison. (g) The corresponding eigenvalues for the long-latency responses in (f).

