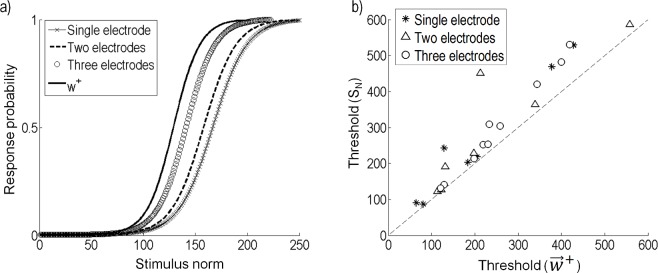
Fig 12. Comparison of stimulation along to a multi-electrode, constant amplitude strategy.
(a) The response probability when stimulating along is compared to a naive strategy that uses only one electrode, or equal amplitude currents on two or three electrodes. (b) The naive strategy (SN) is compared to stimulating along . Only the SN resulting in the lowest thresholds are shown; single electrode (star), two electrodes (triangle) or three electrodes (circle).

