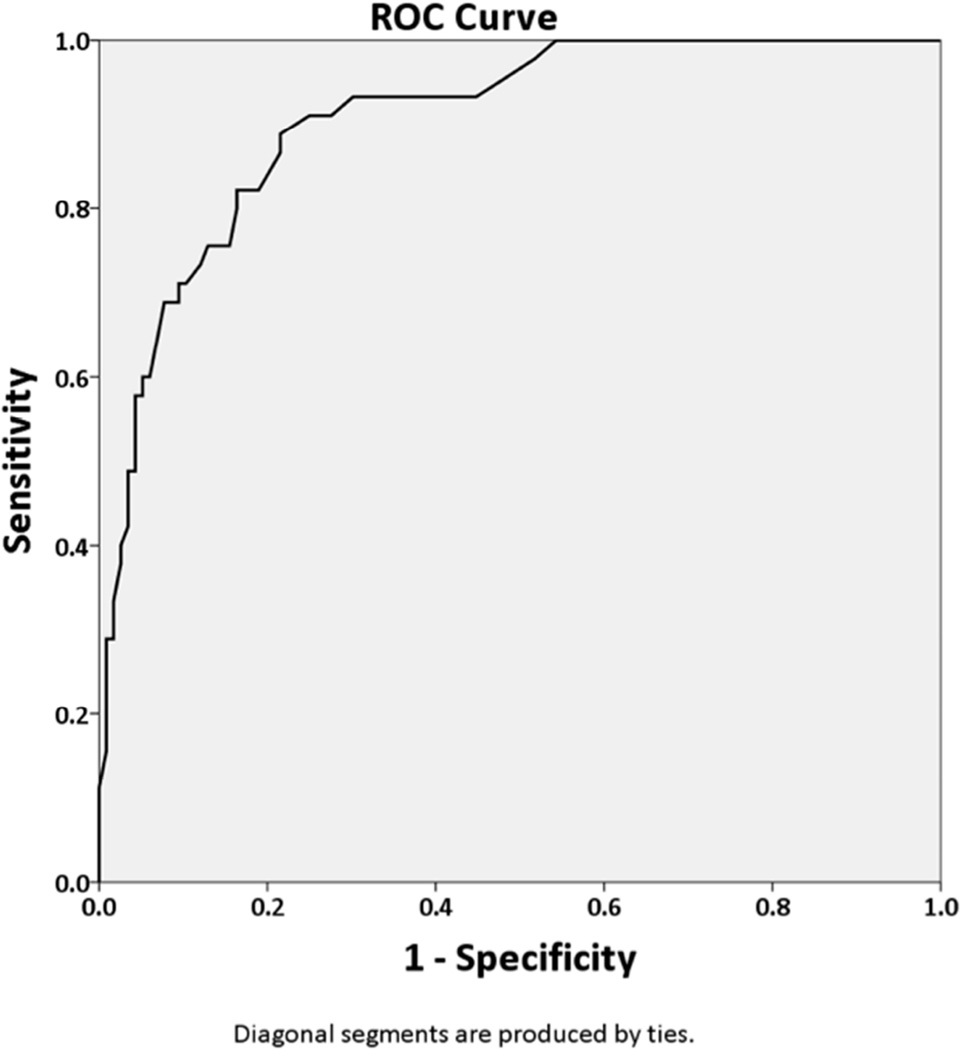
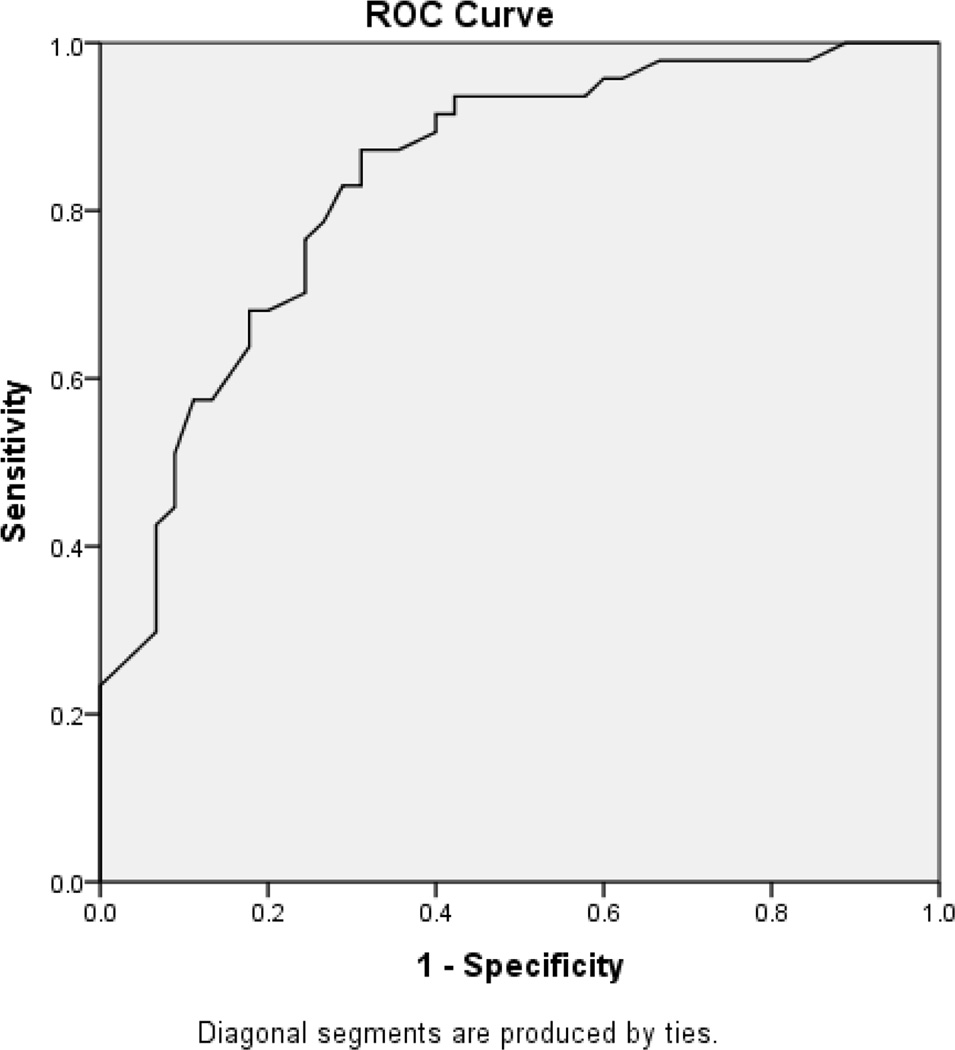
Figure 1. ROC curves for the distinction between subjects without (normal cognition/MCI) or with dementia (1A); and for the distinction between MCI subjects and dementia subjects (1B).
The area under the ROC curves were:
(A) For the distinction between subjects without (normal cognition/MCI) or with dementia was 0.91 (95% CI 0.86–0.95).
(B) For the distinction between MCI and dementia was 0.84 (95% CI 0.76–0.92).


