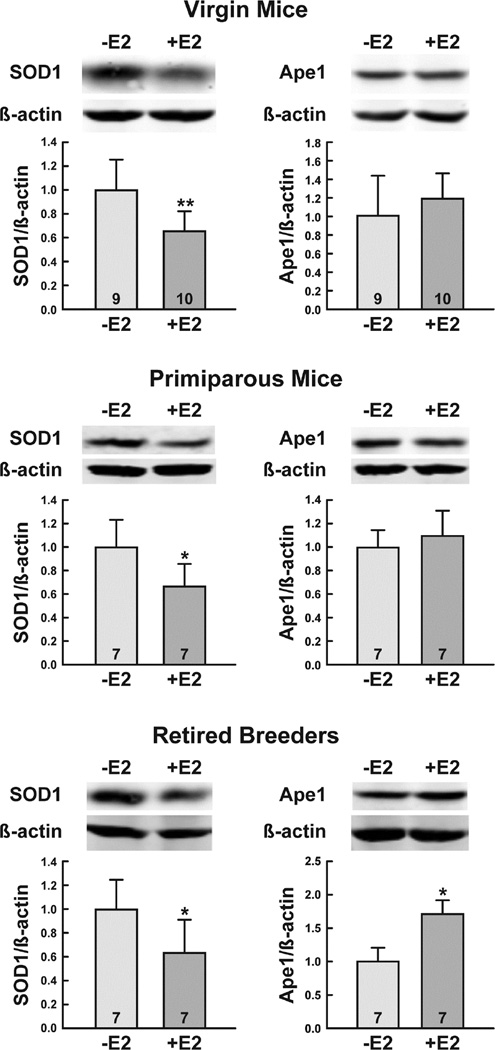
Fig. 5. E2 treatment differentially alters SOD1and Ape1 protein levels.
Ovariectomized female mice were treated with oil or E2 for 7 days. Whole cell extracts were prepared and subjected to quantitative Western blot analysis. Expression of each protein was normalized to the amount of β-actin present. The number of mice included in the oil- and E2-treated groups is indicated at the base of each treatment group bar. Significant differences in oil- and E2-treated mice are indicated by one (*, p<0.05) or two (**, p<0.01) asterisks.

