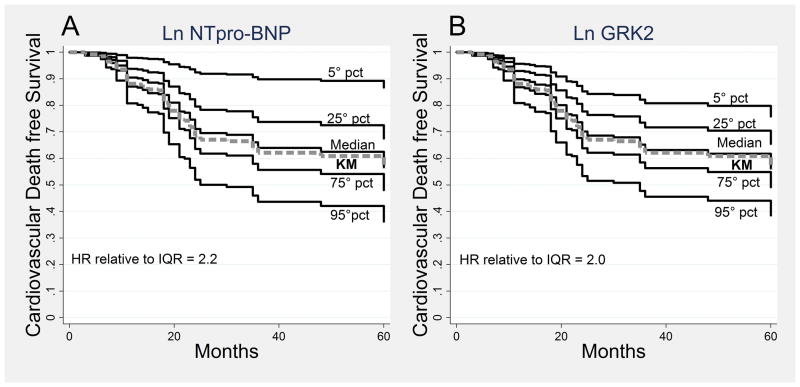
Figure 1.
Cardiovascular death free survival curves at different percentiles (5°, 25°, 50° (median), 75° and 95°) of ln NTpro-BNP (A) and ln GRK2 (B). The curves were obtained from the full Cox model, fixing the ln NTpro-BNP in A and the ln GRK2 in B at the specific percentile, and adjusting for the other covariates at the values observed in the study population (Directly Adjusted Curves). In panel A the adjusting covariates include also the ln GRK2, while, in panel B, ln NTpro-BNP was included. Abbreviations: pct= percentile, KM= Kaplan Meier, HR= Hazard Ratio, IQR= interquartile range, 25°<->75° percentile.

