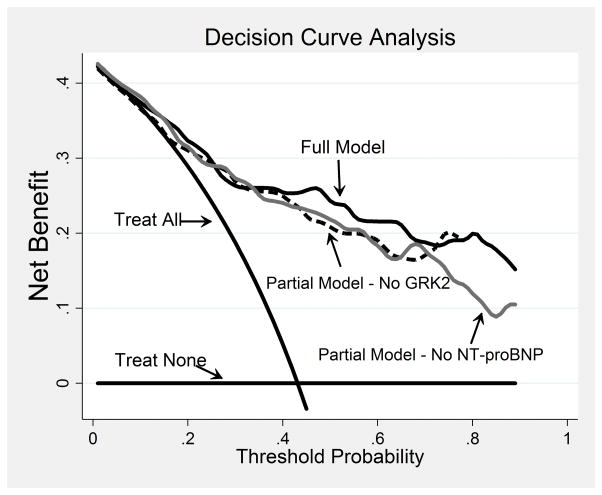
Figure 2.
Decision curve analysis for 60 months cardiac survival. The treat none and treat all curves are compared to the net benefit curves of 3 Cox models: Full Model (continuous black line), Partial Model – No NT-proBNP (continuous gray line) and Partial Model - No GRK2 (dashed black line). The Full Model profile is higher than the 2 Partial Model profiles across the critical range of the survival threshold probabilities (40%–70%). The 2 Partial Models profiles overlap across the threshold span. All 3 models show curves well above that of the treat none and treat all.

