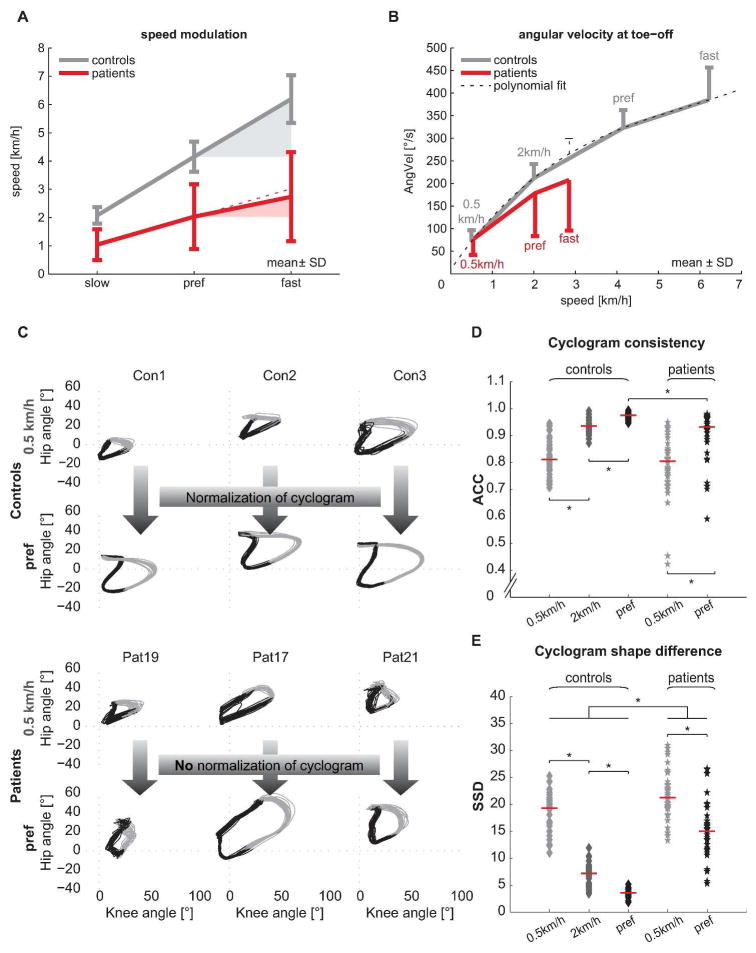
Figure 2. Speed modulation of parameters contributing to PC1.
(A) Absolute speed and speed modulation is limited in iSCI patients. Theoretical linear increase is indicated by the red dotted line. Error bars indicate ± 1SD. (B) The diagram illustrates the modulation of the hip-knee angular velocity at toe-off. A 3rd degree polynomial fit (thin dotted line) was used to interpolate control subjects’ data to obtain their angular velocity at patients’ fast speed. Error bars indicate 1SD. (C) Hip-knee cyclograms of control subjects (top 2 rows) and patients (bottom 2 rows) both at 0.5 km/h and at preferred (pref) walking speed are shown. 20 gait cycles are plotted, black color indicates stance phase, grey color indicates swing phase. (D) The cycle-to-cycle reproducibility of the hip-knee cyclogram (ACC) improved with increasing speed in both groups but was lower in patients at preferred speed. (E) The shape difference of the cyclogram compared to normal (SSD) improved in patients at preferred speed but remained different from controls at all speeds. ACC = angular component of coefficient of correspondence, AngVel = angular velocity at toe-off, SD = standard deviation, SSD = square root of sum of squared distances (cyclogram shape difference). * p < 0.05.

