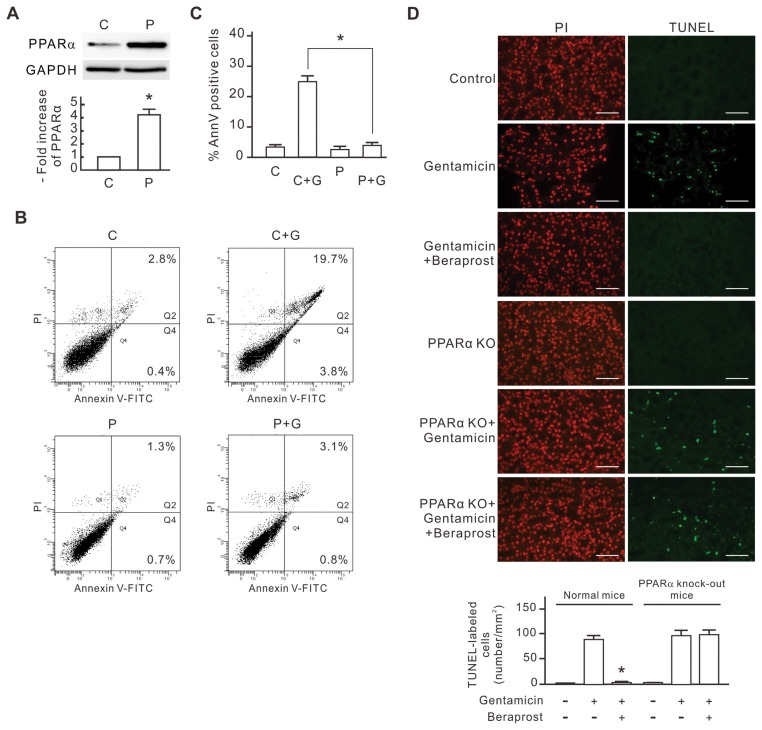
Figure 1.
The inhibitory effect of PPARα overexpression on gentamicin-induced apoptosis in NRK-52E cells. NRK-52E cells were transfected with pcPPAR or blank vectors and then treated with or without 3 mmol/L gentamicin for 24 h. (A) PPARα expression levels in the pcPPAR transfected cells. The level of PPARα protein in each sample was determined by Western blot analysis. GAPDH was used as the loading control. Relative increases in the protein bands are also presented in a bar chart form. Results are expressed as mean ± SD (n = 3). C, blank vector control; P, pcPPAR transfection. *P < 0.01 versus the blank vector control group (by Student t test). (B) Representative flow cytometric data of gentamicin-induced apoptosis. Treated cells were stained with annexin V/PI and analyzed by flow cytometry. The sum of the cell percentages in quadrants 2 and 4 represents the percentage of apoptosis. G, gentamicin treatment. (C) The apoptotic percentage of gentamicin-treated cells. Results are means ± SD (n = 3). *P < 0.01 by Student t test. (D) The protective effect of beraprost against gentamicin-induced renal tubular cell apoptosis in vivo. Mice were injected with saline, gentamicin and beraprost as described in Materials and Methods. Apoptotic cells in kidneys of experimental mice were detected using in situ TUNEL staining. TUNEL-labeled nuclei were revealed as bright spots in cortex sections from gentamicin-treated mice. The identical fields stained for TUNEL were also stained using PI to reveal the positions of cell nuclei. PPARα KO, PPARα knockout mice. The number of TUNEL-labeled cells per millimeter-squared cortex area in each sample was also compiled and demonstrated. Results are expressed as the mean ± SD (n = 6). *P < 0.05 compared with the normal mice treated with gentamicin alone. Scale bar, 50 μm.

