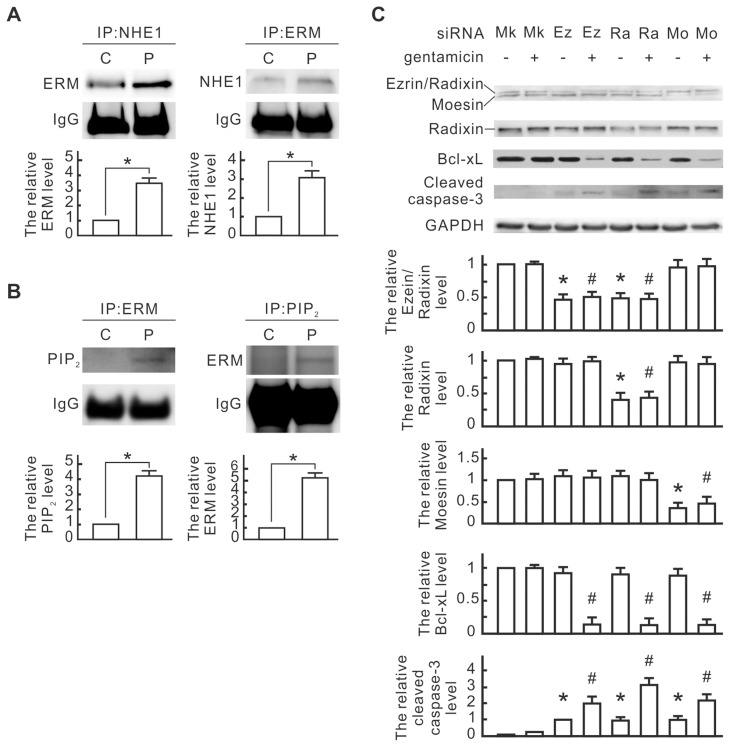
Figure 5.
The involvement of ERM and PIP2 in the PPARα-induced NHE1 signaling pathway. (A) The interaction between NHE1 and ERM. NRK-52E cells were transfected with pcPPAR or blank vectors. NHE1 and ERM in transfected cells were immunoprecipitated with anti-NHE1 and anti-ERM antibodies, respectively. ERM and NHE1 in the immunocomplexes were detected by using Western blotting. IgG was detected as a loading control. Relative increases in the protein bands are also presented in bar chart form. Results are means ± SD (n = 3). *P < 0.05 by Student t test. (B) Interaction between ERM and PIP2. ERM and PIP2 in the transfected cells were immunoprecipitated with anti-ERM and anti-PIP2 antibodies, respectively. PIP2 and ERM in the immunocomplexes were detected by using Western blotting. Relative increases in the protein bands are also presented in bar chart form. Results are means ± SD (n = 3). *P < 0.05 by Student t test. (C) Influence of ERM siRNA transfection on apoptotic signals in the pcPPAR-transfected cells. The pcPPAR-transfected cells were further transfected with ezrin (Ez), radixin (Ra), moesin (Mo) or mock control (Mk) siRNA and then treated with or without 3 mmol/L gentamicin for 24 h. Total proteins of treated cells were analyzed by Western blotting with the specific antibodies as indicated. GAPDH was used as a loading control. Relative increases in the protein bands are also presented in a bar chart form. Results are means ± SD (n = 3). *P < 0.05 versus the mock control group. #P < 0.05 versus the mock control group with gentamicin treatment. Statistical differences between the two groups were determined using the Student t test.

