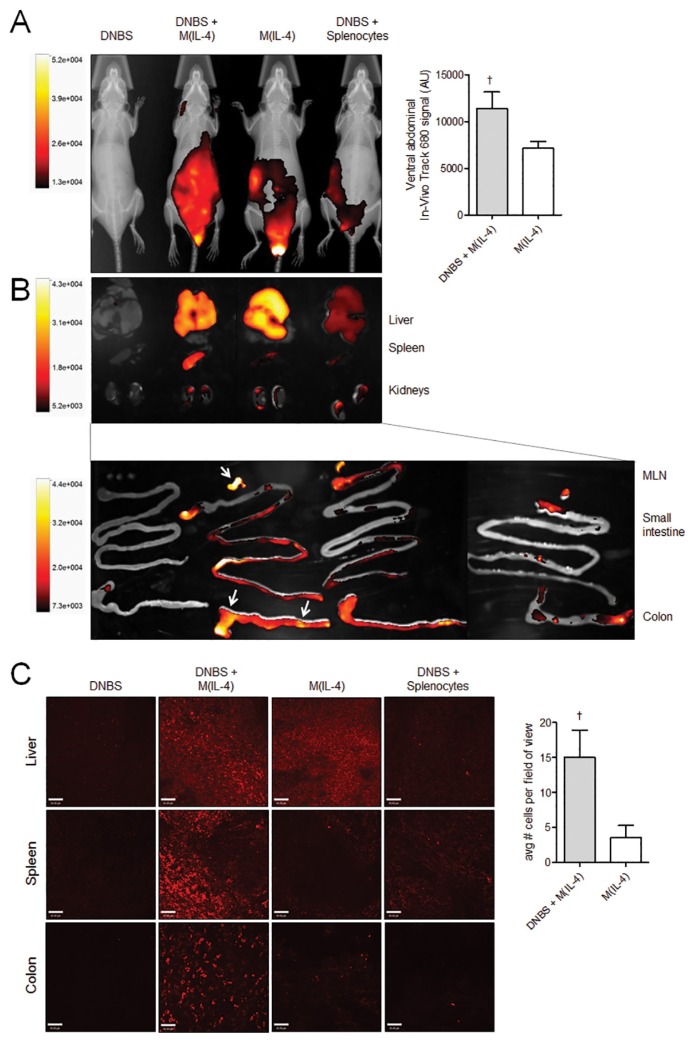
Figure 4.
Transferred M(IL-4)s home to the colon, liver, mesenteric lymph nodes and spleen during DNBS colitis. (A) Macrophages and spleen cells (as a nonspecific control cell) were labeled with fluorescent dye VivoTrack 680 NIR and localized using whole-body imaging; fluorescence on d 3 just before the necropsy is depicted overlying the X-ray images. Throughout the course of the experiment, the majority of cells remained within the peritoneal cavity in a pattern similar to d 3 (data not shown). (B) Whole organs were dissected and reexamined by using the whole-body imaging system to confirm localization to the liver, spleen, mesenteric lymph nodes and colon in M(IL-4) + DNBS–treated mice. Arrows indicate the areas of peak fluorescence. (C) Cellular localization in the liver, spleen and colon was confirmed further with spinning disk confocal microscopy on mounted organ sections. VivoTrack 680–labeled macrophages at 20× magnification were enumerated in triplicate random fields of view. Whole mounted colons from DNBS mice treated with M(IL-4)s contained significantly more macrophages compared with M(IL-4)s into naive control mice. Data are representative of two to three experiments: DNBS, n = 2; DNBS + M(IL-4), n = 3–4; M(IL-4), n = 3–4; DNBS + splenocytes, n = 2. †p < 0.05 (Mann-Whitney U test, one-tailed). Data are represented as the mean ± SEM.

