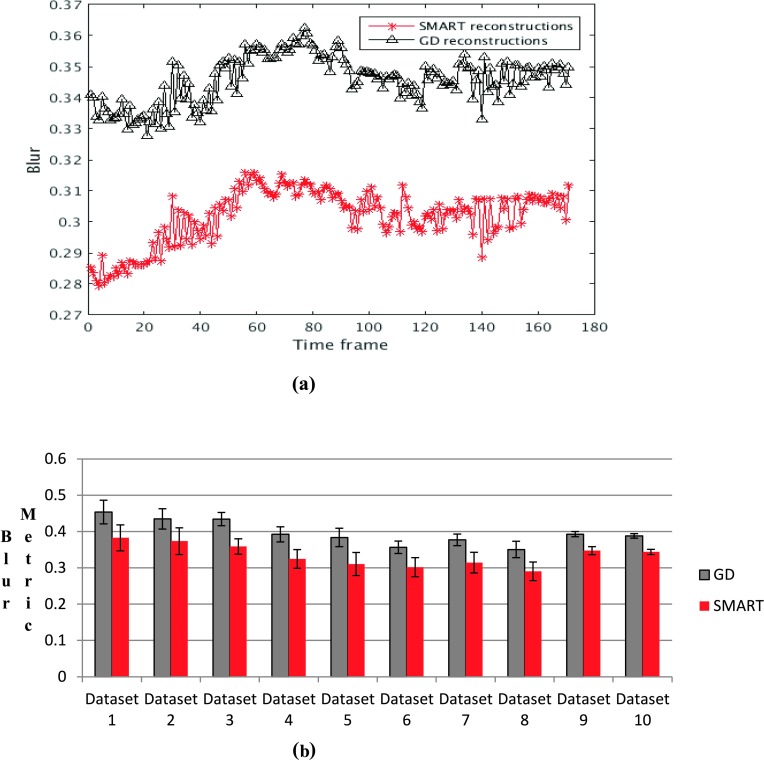
FIG. 5.
Blur metric values for the images reconstructed using SMART and GD based methods. A value close to 1 for the blur metric means that the image is highly blurred whereas a value close to 0 means that the image is very sharp. (a) Blur metric comparison between SB and GD computed on a single slice. (b) A comparison of the average blur metric for the ten datasets, and the mean and standard deviation are reported. In both cases, the blur metric calculated from the GD images is higher than the SMART based reconstructions (see color online version).

