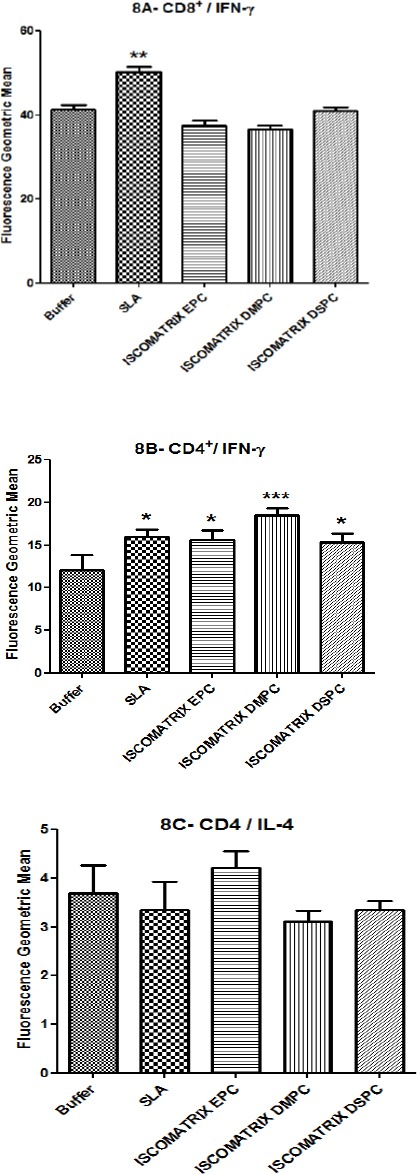
Figure 8.

After last booster, splenocytes were isolated and restimulated, then stained for surface CD8, CD4 and intracellular IFN-γ and IL-4. Splenocytes were gated by side vs forward scatter light followed by staining with CD8Pe-cy5 and CD4Pe-cy5. Plots show log fluorescence intensity for IFN-γ- FITC and IL-4-PE. The data indicate the mean±SEM, (n= 3). *** (P<0.001), ** (P<0.01) and * (P<0.05) denote significant difference from buffer and all other formulations
