Fig. 4.

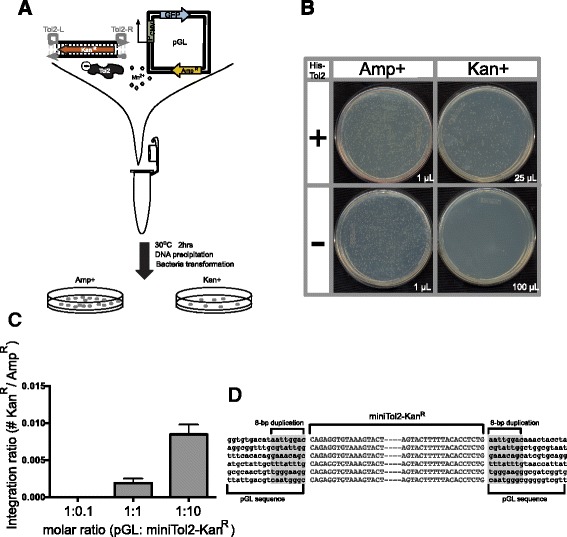
Tol2 in vitro integration assay. a Scheme of in vitro integration assay. b One example miniTol2-Kan R integration, revealing different kanamycin-resistant colony recovery from assays with versus without His-Tol2 protein. The amount of transformed bacteria spread on each plate is indicated. c Tol2-mediated miniTol2-Kan R integration. The amount of target plasmid (pGL) was kept at 0.5 pMol, while PCR fragments were mixed at three different ratios. The ratio of colony numbers (Additional file 3) recovered from LB-Kan+ to LB-Amp+ was used as an indicator of integration activity. Bars represent mean values ± SEM from three independent experiments. d Plasmids isolated from colonies on LB-Kan+ plate were sequenced at both junctions of miniTol2-Kan R insertion. 8-bp target plasmid duplications were indicated. Six examples of the integration junction are shown here
