Fig. 5.

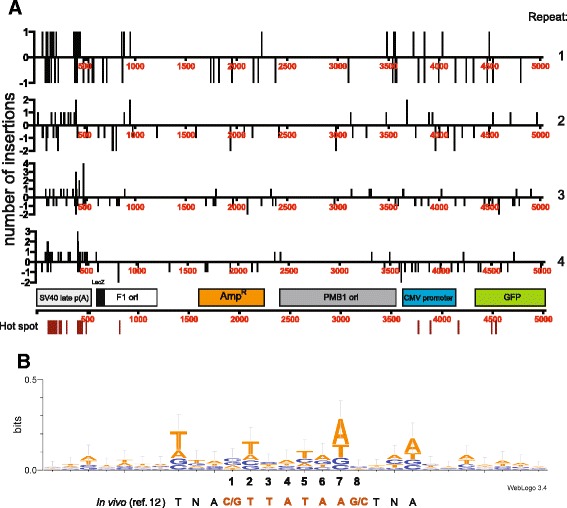
miniTol2 insertion sites and consensus sequence. a Tol2-mediated insertions from four independent experiments were mapped to target plasmid (pGL) for miniTol2-Kan R (n = 266). Y-axis indicates the number of insertion events and orientation (positive: sense orientation; negative: anti-sense orientation) Major features of the pGL vector were also indicated. Red lines below the sequences indicate insertion “hot spots”, defined as the same locations that are discovered in more than one experiment, regardless of the insertion orientation or locations in one experiment that have transposons inserted in both directions (also see Additional file 5). b Tol2 integration site motif analyzed by WebLog (version 3.0) (n = 266) and aligned to a previous indentified weak AT-rich consensus in vivo [12]
