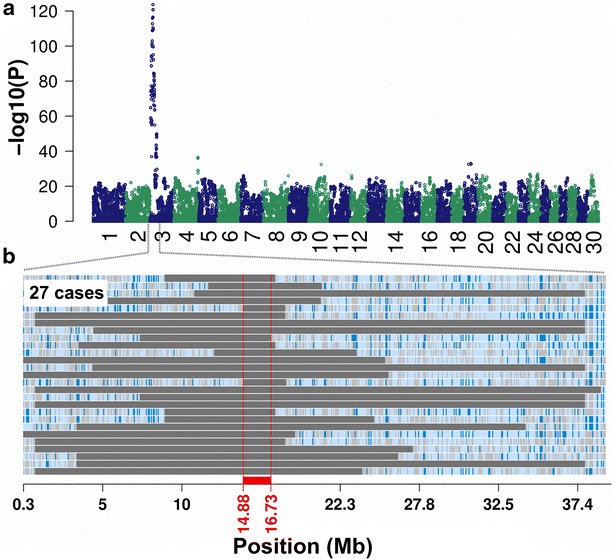
Fig. 2.

Mapping of the genomic region associated with dwarfism. a Association of 787,232 haplotypes with dwarfism in 27 affected and 10,454 unaffected animals. P values were obtained by calculating Fisher exact tests of allelic association. b Autozygosity mapping in 27 animals with dwarfism. Blue and pale blue represent homozygous genotypes (AA and BB), heterozygous genotypes (AB) are displayed in light grey. The solid grey bars represent segments of extended homozygosity in 27 animals with dwarfism. The red bar indicates the shared segment of homozygosity
