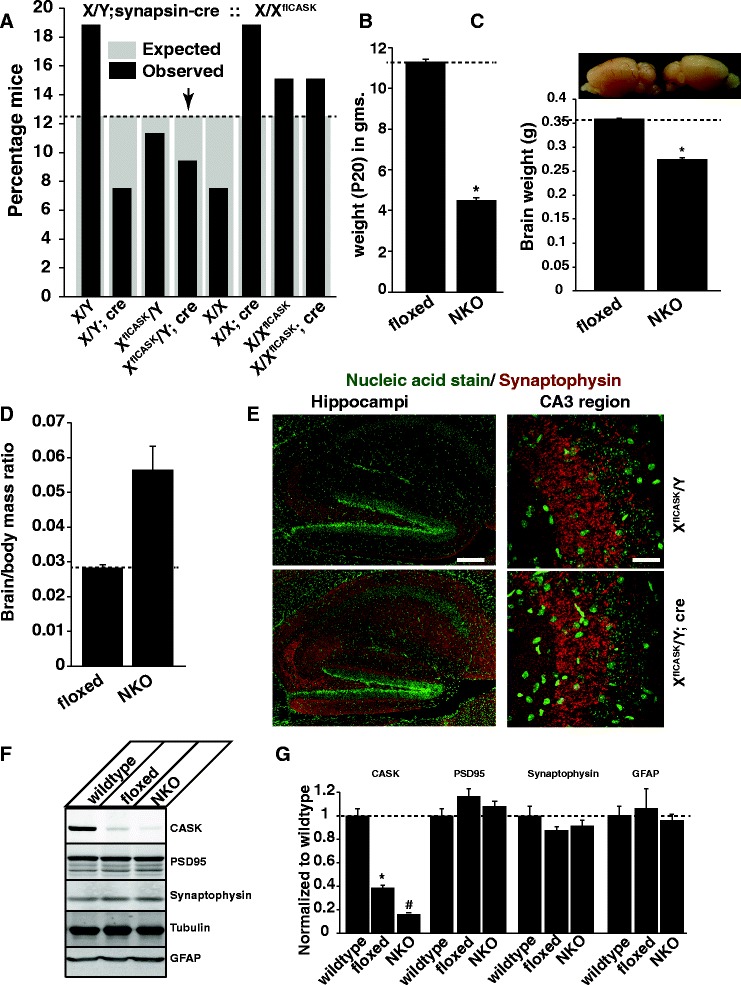
Fig. 2.

Survival and normal brain formation in CASK neuronal knockout mice. a Shows the expected (grey bar) and observed (black bar) percentage of mice with each genotype obtained from crossing the X/Y;synapsin-Cre males with XflCASK/X females; n = 62. Arrow indicates the neuronal CASK knockout group. b Weight of CASK floxed (floxed) and neuronal CASK knockout male mice (NKO) at 20 days of age. (* indicates p < 0.05; n = 5) (c) Representative brain halves and brain weight at 21 days of age from CASK (XflCASK/Y) (floxed) and neuronal CASK knockout (NKO) mice. (* indicates p < 0.05; n = 4). d Ratio of brain to body weight of CASK (XflCASK/Y) (floxed) and neuronal CASK knockout mice (NKO). (* indicates p < 0.05; n = 4). e Image showing hippocampus from 21 day old CASK floxed and CASK neuronal knockout mice. Green staining indicates nucleic acid and red staining indicates synaptophysin. Note that there is no significant change in the lamination and CA3 region synaptophysin staining in CASK neuronal knockout mice. f Representative Western blot showing endogenous levels of CASK, PSD95, synaptophysin and tubulin from 21 day old mice. g Western blot protein quantitation where data is normalized to tubulin and expressed relative to wild-type levels. Bar graphs are plotted as mean ± SEM. (* indicates p < 0.05; n = 3). Wild-type represents littermate mice with unperturbed CASK gene, floxed indicates CASK floxed mice and NKO indicates neuron-specific CASK knockout mice
