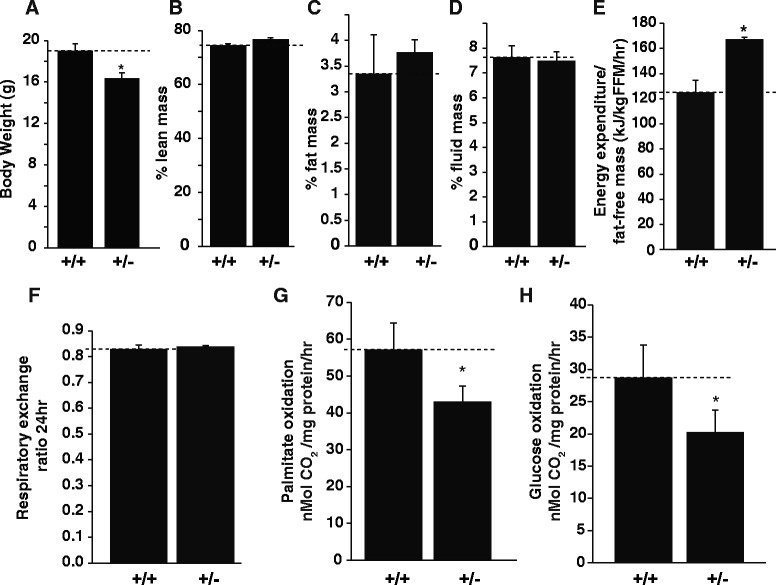
Fig. 6.

CASK (+/-) mutant mice exhibit growth retardation and skeletal muscle metabolic defects. Comparison of (a) body weight, (b) percentage lean mass, (c) percentage fat mass and (d) percentage fluid mass. All comparisons are presented as mean ± SEM, (* indicates p < 0.05; n = 5). e Energy expenditure/fat-free mass/hr in a 24-h period from CASK (+/-) mice compared to sex-matched CASK (+/+) littermate control. Data is presented as mean ± SEM (* indicates p < 0.05; n = 5). f Respiratory exchange ratio from CASK (+/-) mice compared to sex-matched CASK (+/+) littermate control. Data is presented as mean ± SEM. g Fatty acid oxidation rate and (h) glucose oxidation rate measured in skeletal muscle homogenates from CASK (+/+) and CASK (+/-) sex-matched littermate mice. Bar graphs are plotted as mean ± SEM. (* indicates p < 0.05; n = 5). All experiments were performed on one month old mice
