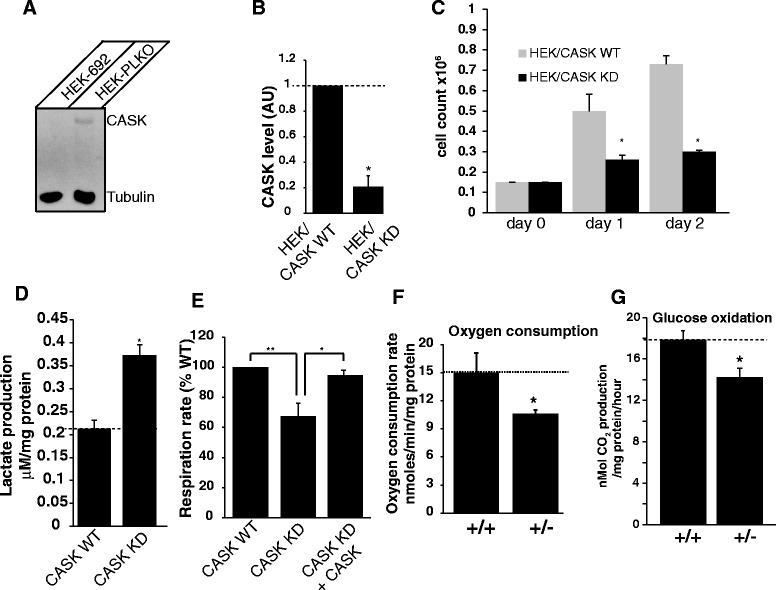
Fig. 7.

Reduction of CASK expression in cells and brain reduces oxidative metabolism. a Representative Western blot showing endogenous CASK expression in human embryonic kidney (HEK293-PLKO) cells as well as CASK knockdown in HEK293 cells using shRNA692 (HEK-692). b Quantitation of CASK knockdown (KD) in HEK293 cells using shRNA692 (* indicates p < 0.05; n = 3) (WT = wildtype). c Hemocytometer cell count in CASK knockdown (KD) HEK293 cells compared to wild-type control cells (WT). Bar graphs are plotted as mean ± SEM (n = 4; * indicates p < 0.05). d Lactate measurement from the culture media of wild-type control (WT) or CASK knockdown (KD) HEK293 cells. Bar graphs are plotted as mean ± SEM (* indicates p < 0.05; n = 3). e Total cellular respiration rate in CASK knockdown (KD) HEK293 cells and CASK knockdown HEK293 cells overexpressing recombinant rat CASK protein (KD + CASK) compared to the wild-type control cells (WT). Respiration is normalized to total protein levels (n = 4; * indicates p < 0.05, ** indicates p < 0.01). f Oxygen consumption rate measured in brain homogenates isolated from one month old CASK (+/+) and CASK (+/-) mice. Respiration rate is normalized to the total protein content (* indicates p < 0.05; n = 4). g Glucose oxidation rate measured in brain homogenates isolated from CASK (+/+) and CASK (+/-) sex-matched littermate mice (* indicates p < 0.05; n = 4)
