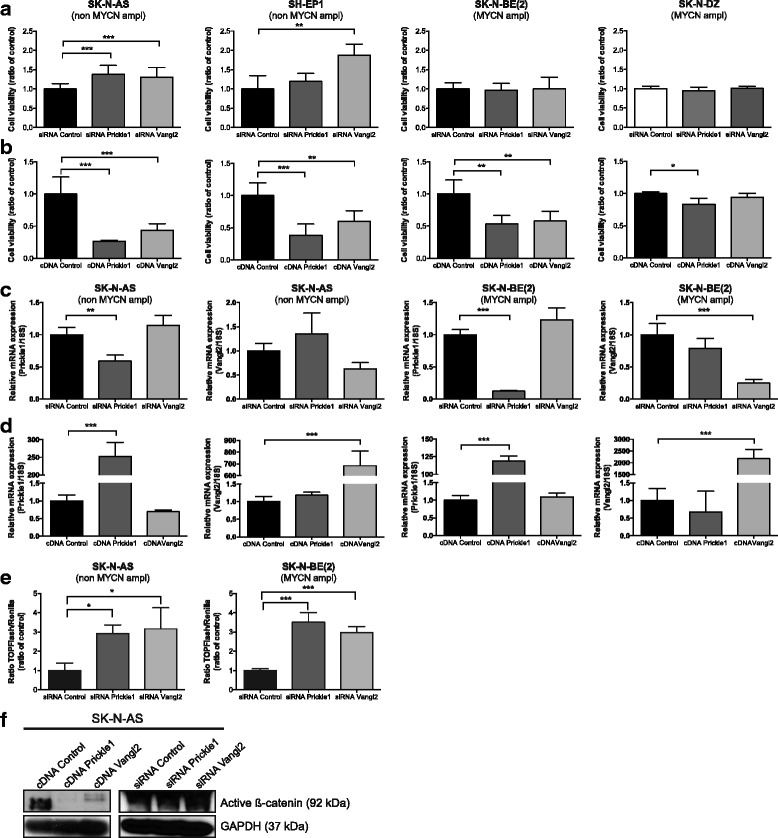
Fig. 2.

Knockdown and overexpression of Prickle1 and Vangl2 alter neuroblastoma cell viability and affect β-catenin expression. a Transfection with siRNA against Prickle1 and Vangl2 resulted in a significant increase of cell viability compared to control cells transfected with scrambled siRNA sequence (48 h) in SK-N-AS and SH-EP1, while no effects were observed in SK-N-BE (2) and SK-N-DZ cells (one-way ANOVA with Bonferroni post-test, SK-N-AS: P < 0.0001 control vs Prickle1 P < 0.0001, control vs Vangl2 P = 0.0003; SH-EP1: P = 0.0023 control vs Vangl2 P = 0.0016). b Overexpression of Prickle1 and Vangl2 in SK-N-AS, SH-EP1, SK-N-BE (2) and SK-N-DZ decreased cell viability significantly, compared control transfected cells (one-way ANOVA with Bonferroni post-test, SK-N-AS: P < 0.0001 control vs Prickle1 P < 0.0001, control vs Vangl2 P = 0.0003, SH-EP1: P = 0.0004 control vs Prickle1 P = 0.0002, control vs Vangl2 P = 0.013, SK-N-BE (2): P = 0.0014 control vs Prickle1 P = 0.019 control vs Vangl2 P = 0.0025 and SK-N-DZ: P = 0.020, control vs Prickle1 P = 0.014). Cell viability was assessed by manually courting in microscope chamber. Mean with SD are displayed, the experiments were repeated with similar results. c, d mRNA expression of Prickle1 and Vangl2 after knockdown and overexpression of Prickle1 or Vangl2 in neuroblastoma cells. All transfections induced significant up-/downregulation of its target gene except from siRNA Vangl2 in SK-N-AS (one-way ANOVA with Bonferroni post-test: SK-N-AS: control vs siRNA Prickle1 P = 0.0024, control vs cDNA Prickle1 P < 0.0001 and control vs cDNA Vangl2 P < 0.0001, SK-N-BE (2): control vs siRNA Prickle1 P < 0.0001, control vs siRNA Vangl2 P = 0.0002, control vs cDNA Prickle1 P < 0.0001 and control vs cDNA Vangl2 P = 0.0003). Data displayed is the mean ± S.D. of three determinations, assessed by quantitative real-time PCR. e The transcriptional activity of β-catenin measured as TOPflash luciferase activity was significantly induced after Prickle1 or Vangl2 knockdown (one-way ANOVA with Bonferroni post-test, SK-N-AS P = 0.0194, control vs siRNA Prickle1 P = 0.034, control vs siRNA Vangl2 P = 0.021 and SK-N-BE (2) P = 0.0003, control vs siRNA Prickle1 P = 0.0002, control vs siRNA Vangl2 P = 0.0009). Values are mean ± S.D., the experiment was repeated twice. f Protein expression of active β-catenin after upregulated or downregulated Prickle1 or Vangl2 in SK-N-AS (48 h transfection), determined by western blotting. *P < 0.05, **P < 0.01, ***P < 0.001
