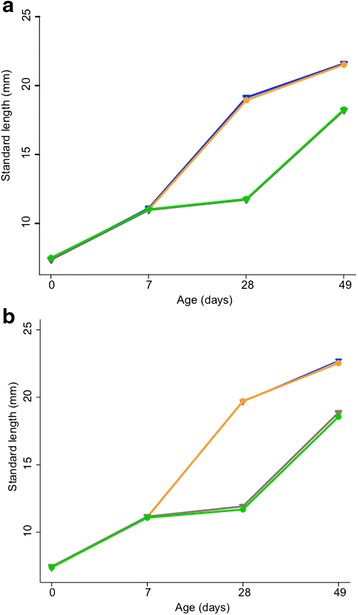
Fig. 1.

Mean growth trajectories of fish separated by inbreeding and diet. Data shown for growth periods prior to sexual maturity for (a) females, (b) males. Blue triangles = outbred control diet, brown triangles = outbred low food diet, orange circles = inbred control diet, green circles = low food diet
