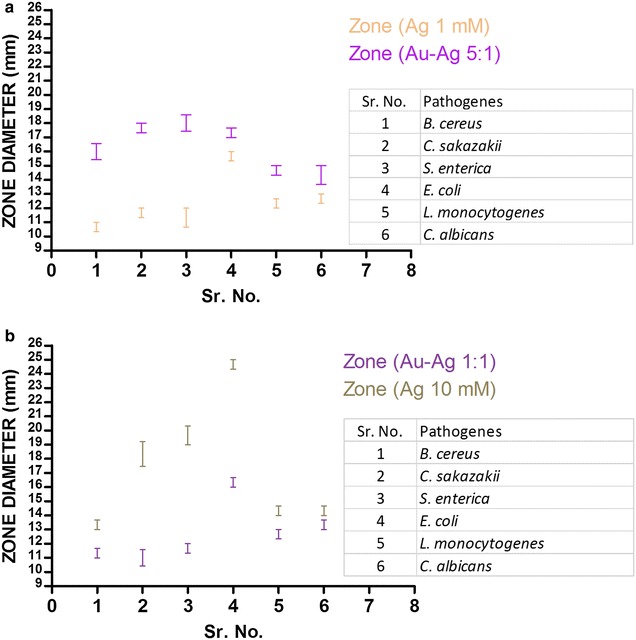
Fig. 6.

Disk diffusion analysis showing the zone of inhibition of the AgNPs and Au–Ag nanocomposite specimens: a Standard error of mean (SEM) of zone of inhibition by specimen of AgNPs (1 mM AgNO3) and Au–Ag nanocomposite (1:5 composition), b Standard error of mean (SEM) of zone of inhibition by specimen of AgNPs (10 mM AgNO3) and Au–Ag nanocomposite (1:1 composition)
