
Fig. 2.
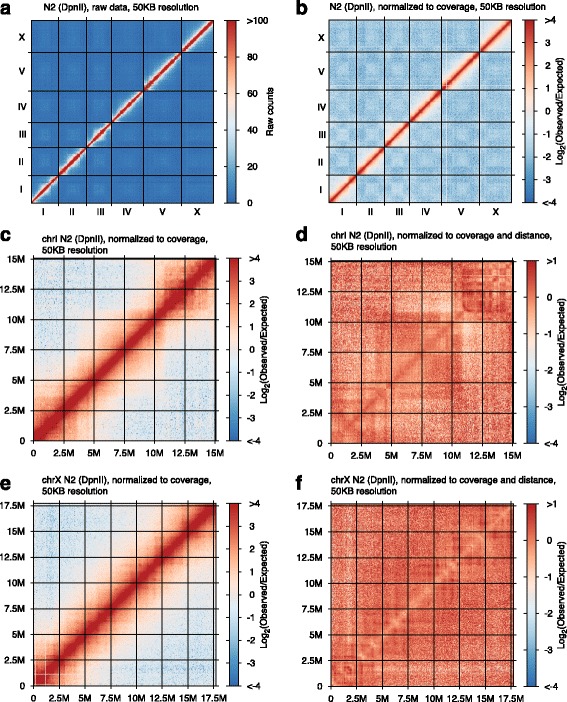
Chromatin interaction intensity maps. a Heat map showing raw counts of observed chromatin contacts on a genome-wide scale with 50KB bins (data from wild type N2 young adults). b Binned chromatin interaction map for wild type N2 young adults displayed with color representing the Log2 of the observed/expected ratio for each 50KB bin pair. c Magnified Log2 plot as in B, but focused just on chromosome I. d A further normalization of the plot in Panel C in which the interaction level for each combination of 50KB intervals is normalized to other pairs of intervals separated by a similar distance (using HOMER software [40]). e Log2 of the observed/expected ratio of interaction frequency (similar to panel C) for the X chromosome. f Coverage and distance normalized interaction plot (similar to panel D) for the X chromosome