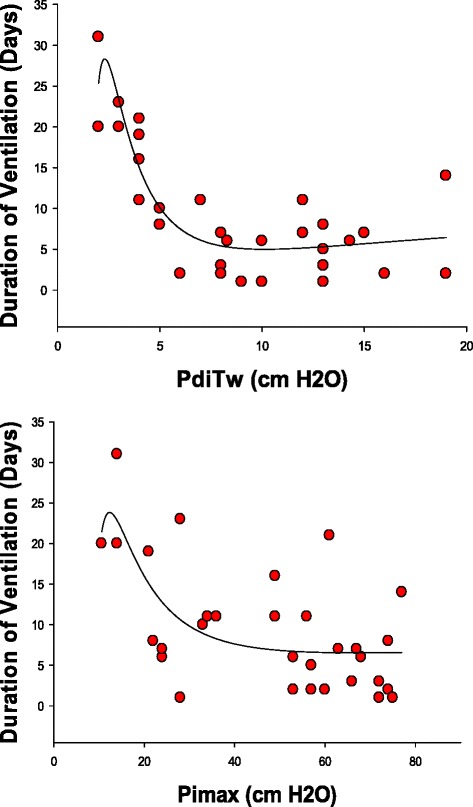
Fig. 5.

The top panel presents the duration of mechanical ventilation (y axis) as a function of the PdiTw (x axis). The bottom panel presents the duration of mechanical ventilation (y axis) as a function of the Pimax (x axis). Regression lines represent best curve fits of data to inverse third order exponential equations, with equation parameters and statistical information presented in Table 1. Both PdiTw and Pimax were significant predictors of duration of mechanical ventilation. PdiTw transdiaphragmatic twitch pressure in response to bilateral magnetic stimulation of the phrenic nerves, Pimax maximum inspiratory pressure
