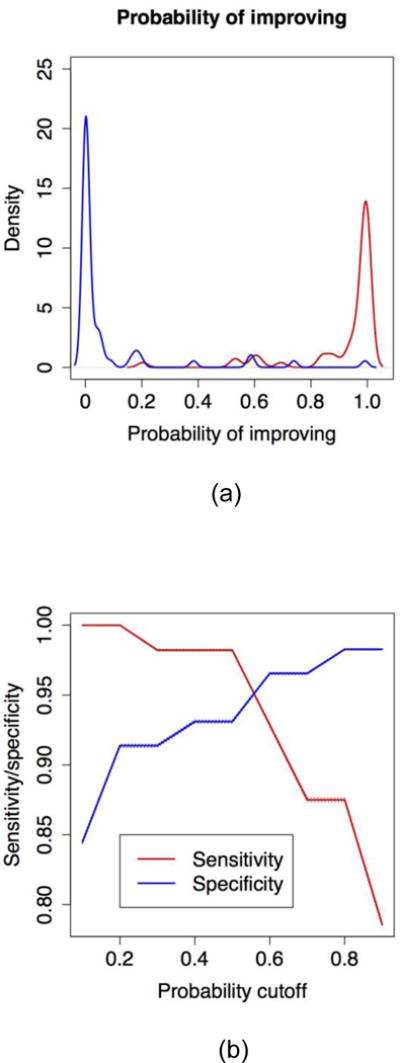
Figure 2.

(a) Distribution of the predicted probability of improving for patients rated improved by the experts (red curve) and patients rated not improved by experts (blue curve). (b) Sensitivity (red line) and specificity (blue line) of the predicted classification of patients into “improved” and “not improved” as a function of the predicted probability cutoff. The cutoffs considered are 0.1, 0.2, 0.3, … 0.9 and the predicted classifications are derived as follow: if the predicted probability for a subject is greater than the probability cutoff, the subject is rated as “improved”, otherwise subject is not.
