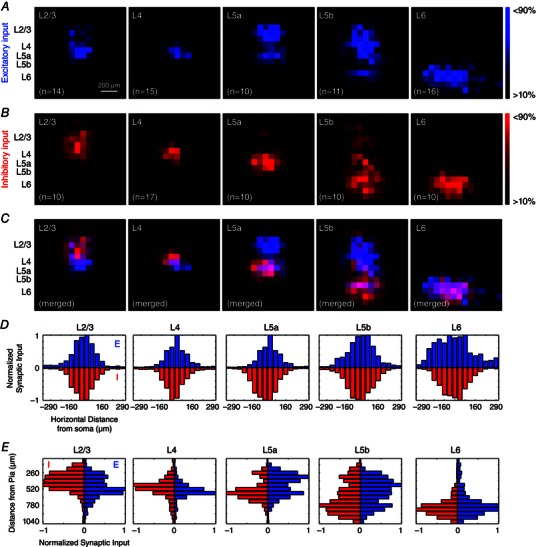
Figure 6. Excitatory and inhibitory synaptic connectivity spatially overlap in a balanced manner for each layer across V1 circuits .

A, excitatory synaptic input maps are normalized within respective postsynaptic layers and re‐plotted from black to blue. Dominant local pathways are displayed by filtering the lower 10% of excitatory inputs based upon EPSC amplitude and scaling the respective laminar maps to 90% of the largest excitatory synaptic inputs measured. B, inhibitory synaptic input maps are normalized within respective postsynaptic layers and plotted across lamina, as in (A) but colour coded from black to red. Consistent with (A), dominant local pathways are displayed from filtering the lower 10% of excitatory inputs based upon IPSC amplitude and scaling the respective maps to 90% of the largest inhibitory synaptic inputs measured within respective postsynaptic layers. C, excitatory and inhibitory normalized input maps are merged according to the laminar position of recorded postsynaptic neurons; violet pixels represent locations of matched synaptic input from both presynaptic excitatory and inhibitory input domains. D, horizontal distribution of normalized excitatory inputs (blue) and inhibitory inputs (red) are plotted for inputs measured across the vertical vector on the LSPS mapping grid to the recorded postsynaptic neurons. E, vertical distribution of normalized synaptic inputs are plotted for inputs measured across the horizontal vector on the LSPS mapping grid to the recorded postsynaptic neurons.
