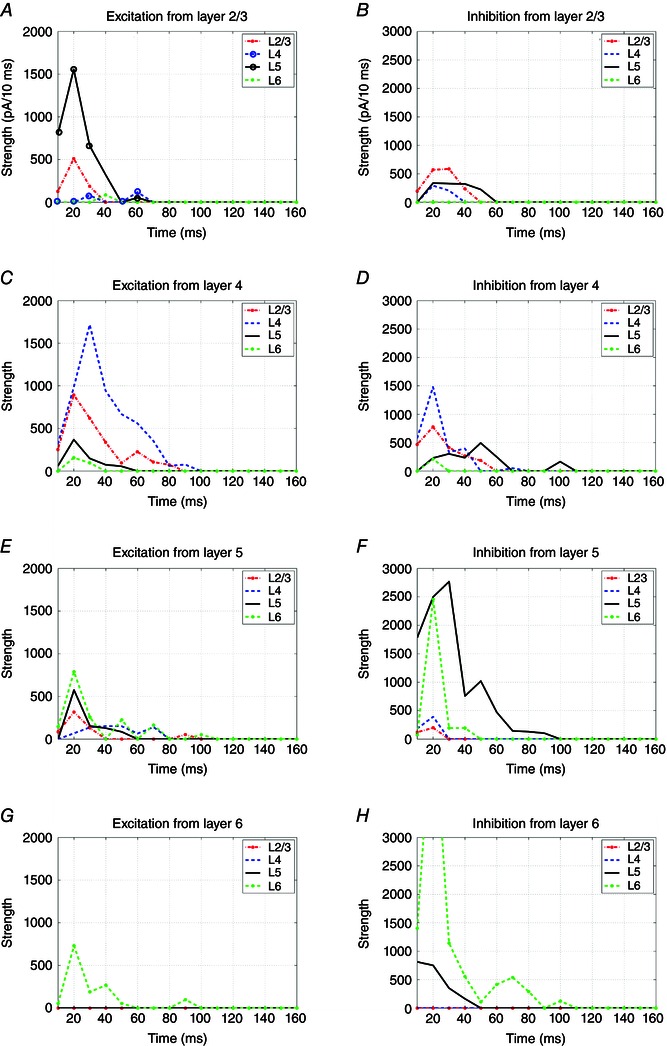
Figure 8. The temporal evolution and laminar distributions of local V1 circuit inputs to excitatory pyramidal neurons across different cortical layers in response to layer‐specific photostimulation .

A, C, E and G, each showing excitatory inputs to L2/3, L4, L5 and L6 excitatory neurons in response to photostimulation in L2/3, L4, L5 and L6, respectively. B, D, F and H, each showing inhibitory inputs to L2/3, L4, L5 and L6 excitatory neurons in response to photostimulation in L2/3, L4, L5 and L6, respectively. The x‐axis represents the time (ms) and the y‐axis represents the input strength (integrated synaptic input strength, pA/10 ms). Lines with different colours indicate the plots of inputs to the specified cortical layers.
