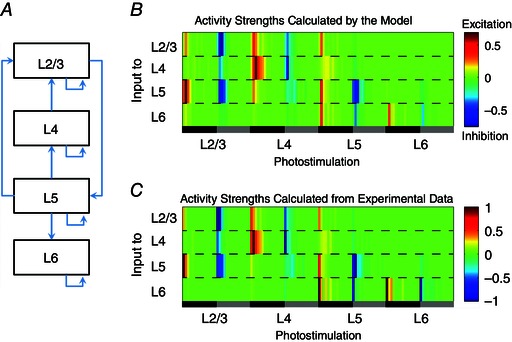
Figure 9. Photostimulation mapped circuit activities are simulated by the discrete dynamical model .

A simplified laminar connectivity map (A) and the temporal evolution data across layers are used for the prior information in the model. B, synaptic input strengths at given time points in different cortical layers simulated by the discrete dynamical model with the optimal connectivity matrix (see Methods) [0.7818, −0.04, −0.0049, 0; 0, 0.6933, 0.0129, 0; 0.2200, 0, 0.6087, 0; 0, 0, 0.1086, 0.3108]. C, synaptic input strengths at given time points in different layers observed by experiments. The x‐axis of (B) and (C) represents the conditions of photostimulation in L2/3, L4, L5 and L6. For each photostimulation in a specified layer, the dark zone indicates the temporal domain (150 ms post‐photostimulation) of excitatory inputs evoked by photostimulation, whereas the grey zone indicates the temporal domain (150 ms post‐photostimulation) of inhibitory inputs. The y‐axis of (B) and (C) represents the input strengths for L2/3, L4, L5 and L6, according to the colour scales, in which the relative activation strengths are coded at given time points.
