
Figure 1. Receiver operating characteristic curves for the prediction of NSCLC.
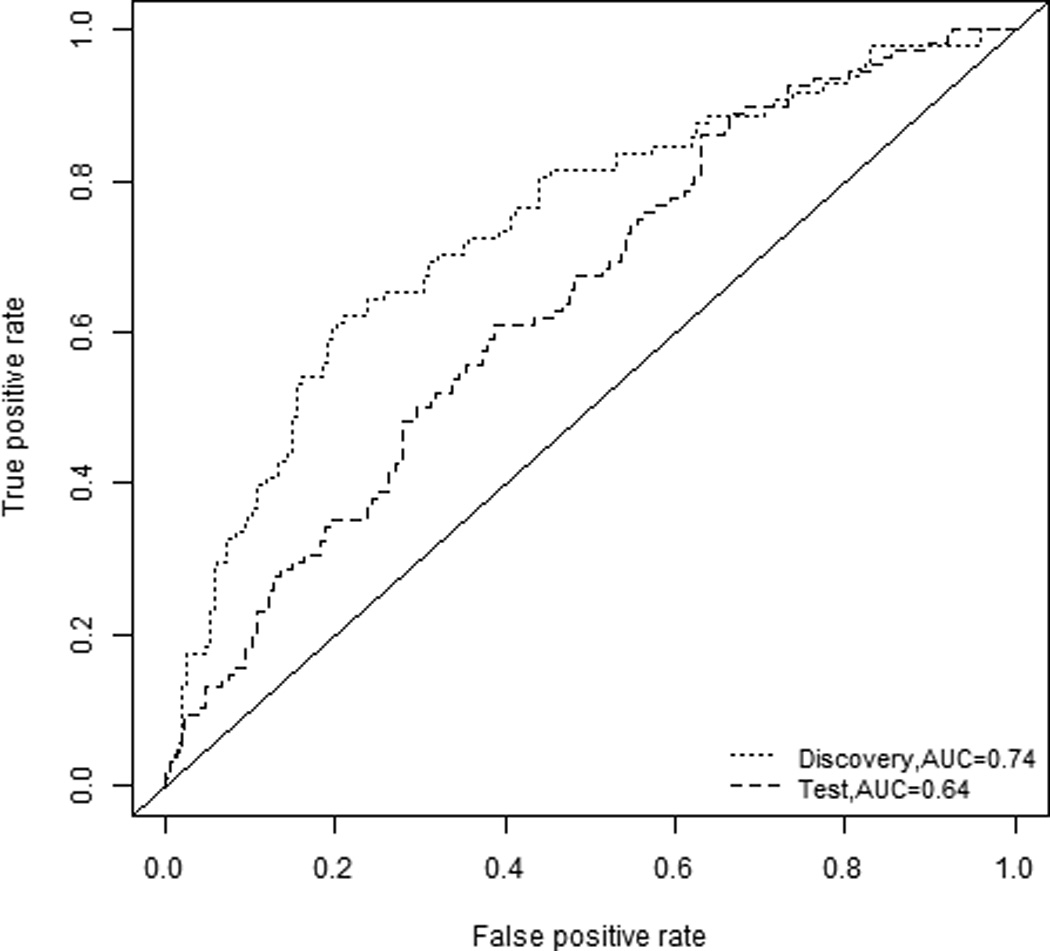
ROC curves are shown for the combination glycan panel for the discovery set (green, AUC 0.74) and the test set (red, AUC 0.64)
Official websites use .gov
A
.gov website belongs to an official
government organization in the United States.
Secure .gov websites use HTTPS
A lock (
) or https:// means you've safely
connected to the .gov website. Share sensitive
information only on official, secure websites.
ROC curves are shown for the combination glycan panel for the discovery set (green, AUC 0.74) and the test set (red, AUC 0.64)