
Figure 2. Metabolic hyperpolarized-pyruvate NMR reveals differences between normal and AML murine bone marrow.
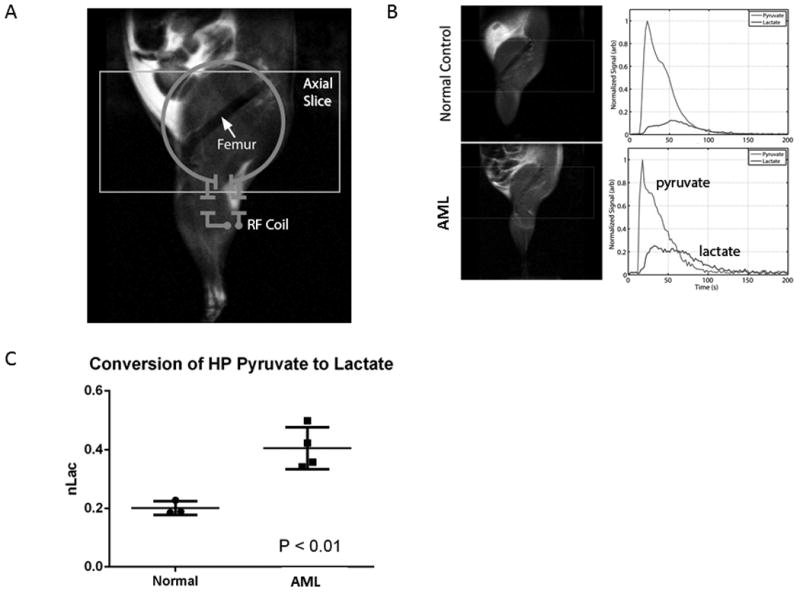
A. Illustration of slice prescription and RF coil placement for hyperpolarized (HP) 13C acquisitions. B. (Left) T2-weighted anatomic images of normal control (top) and AML-bearing animal (bottom). (Right) Representative traces illustrate the arrival of HP pyruvate and its subsequent conversion into HP lactate. C. Normalized area under the HP lactate curve (nLac), which corresponds with the rate of conversion of the bolus of pyruvate into lactate.