
Figure 5. TH-302 and sorafenib have synergistic activity in vivo.
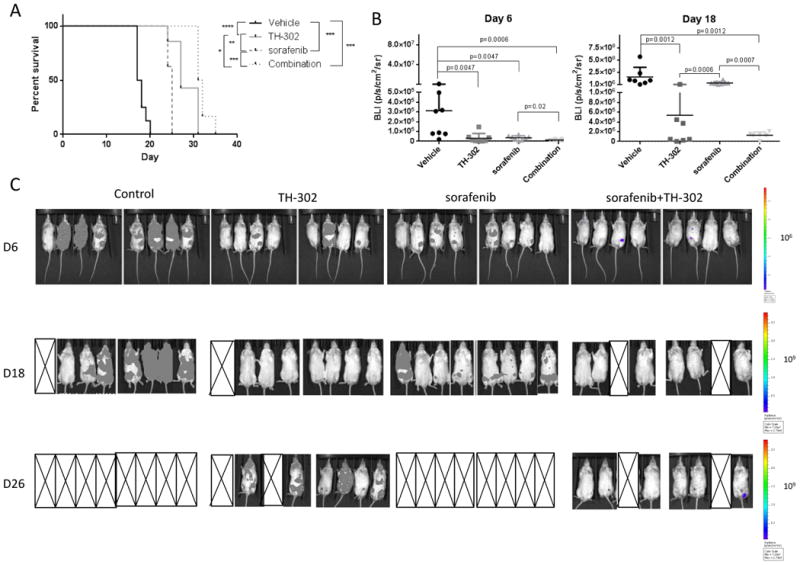
A. Survival curves of NSG mice (N=5/group) transplanted with FLT/3ITD MOLM-13-LUC-GFP cells and treated with TH-302, sorafenib, or a combination starting on day 3 after cell injection. B. Quantification of tumor burden from bioluminescence images (BLI) on day 6 and 18 after cell transplantation. C. Optical imaging of mice transplanted with MOLM-13 cells and treated with vehicle, TH-302, sorafenib or the combination of TH-302 and sorafenib and performed on days 6, 18 and 26 after transplantation. X denotes mice that died.* P<0.05; ** P<0.01; *** P<0.001.