
Figure 4.
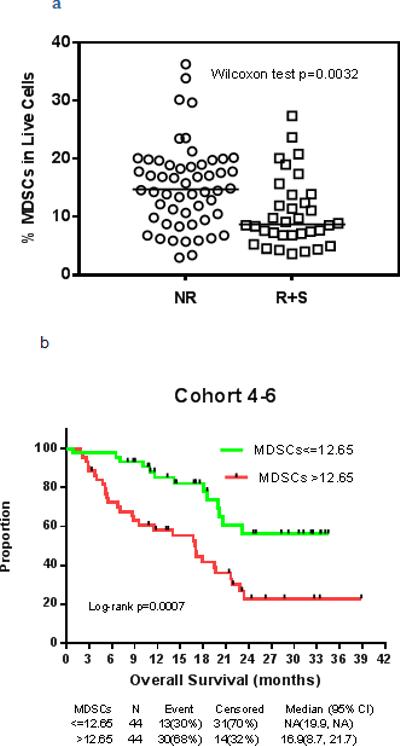
Myeloid-derived suppressor cells in ipilimumab-refractory and -naïve patients receiving nivolumab. A, Proportion of CD14+/CD11b+/HLA DRlow MDSC cells present before nivolumab treatment, as a percent of total live cells, in patients grouped as NR (nonresponders) and responders + stable patients (R+S). B, Kaplan-Meyer plot ofrelation of overall survival to proportion of CD14+/CD11b+/HLA DRlow MDSC cells before treatment. Cut-point was at the median (12.65 months). Red curve is survival for patients below the median, Green shows survival for those patients above the median. Data for groups displayed beneath plot.