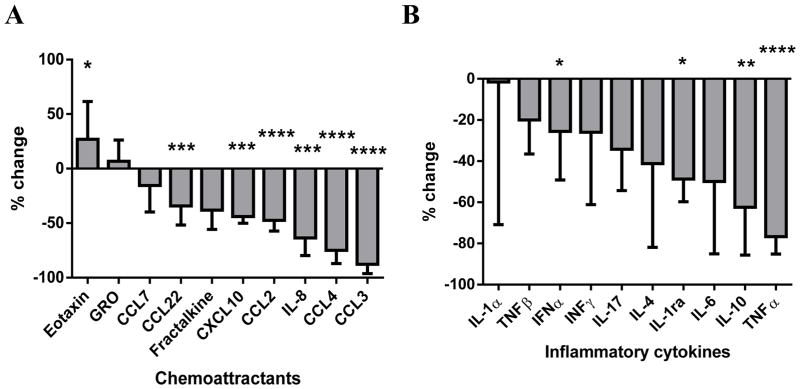
Figure 1. Ibrutinib alters the expression of inflammatory cytokines and chemokines in serum from patients with CLL.
A, The percent changes in the evaluated chemokines after eight weeks on ibrutinib treatment compared to pre-treatment levels. B, The percent changes in evaluated inflammatory cytokines after eight weeks on ibrutinib treatment compared to pre-treatment levels. In both panels, median with interquartile range is shown. See supplementary table for complete list of tested cytokines/chemokines and changes over time. Statistical analyses were by Wilcoxon matched-pairs signed rank test. Asterisks indicate degree of statistical significance compared to pre-treatment levels: * P < .05, ** P < .01, *** P < .001, and **** P < .0001.

