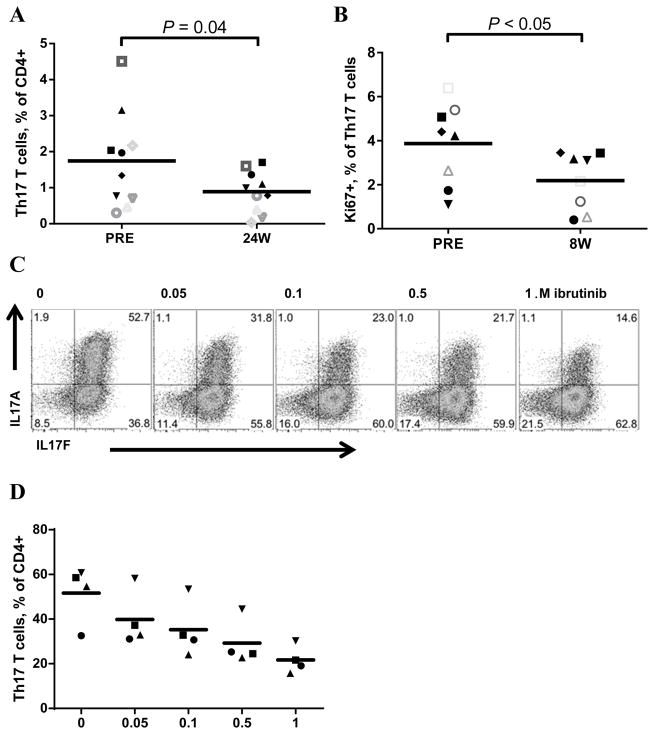
Figure 3. Ibrutinib treatment leads to a reduction in the Th17 T-cell subset and inhibits in vitro differentiation of murine Th17 cells.
A, The percentage of Th17 cells (CXCR3neg, CCR6+) of total CD4+ T cells pre-treatment (PRE) and after 24 weeks of ibrutinib treatment (24W), n=10. Line represents mean. B, The percentage of Th17 T cells that express Ki67 pre-treatment (PRE) and after eight weeks (8W) of ibrutinib treatment, n=8. Line represents mean. C, In vitro differentiation of murine CD4+ Th17 cells, Th17 phenotype assessed by staining for IL17A expression, representative dot plots also including IL17F staining from one of four experiments shown, concentration of ibrutinib in the culture medium indicated on top of each panel, 0 represents vehicle. D, The percentage of total CD4+ T cells differentiating into IL17A positive Th17 cells upon in vitro ibrutinib. Each symbol represents an individual experiment, line represents mean. Drug effect assessed by 2-way ANOVA analysis (P = .005), statistical analyses (A and B) were determined by Student’s paired t-test.

