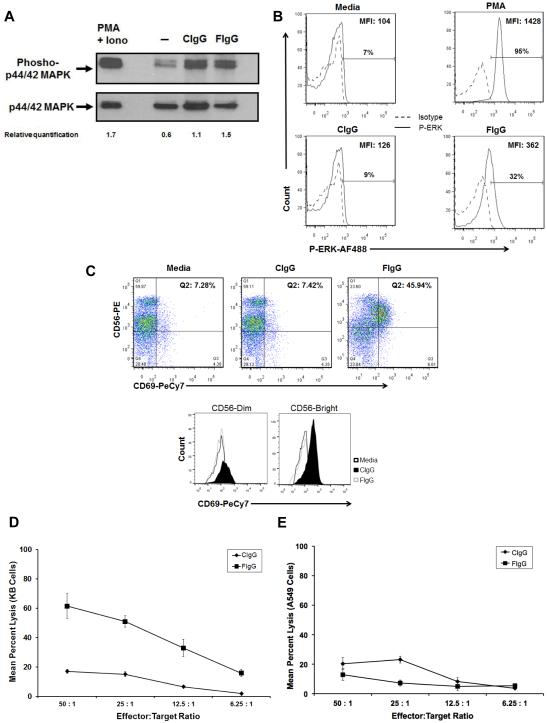
Figure 2. Phospho-ERK upregulation and cytolytic activity of NK cells in response to F-IgG stimulation.
(A) Assessment by immunoblot. Freshly isolated NK cells were plated on immobilized C‐IgG or F‐IgG at 37°C for 15 minutes. Control conditions consisted of NK cells treated with PBS or PMA (positive control). NK cells were harvested and lysed for immunoblot analysis of phospho‐ERK. Total ERK was measured as a loading control and relative quantification of P‐MAPK vs ERK are indicated. (B) Assessment by intracellular flow cytometry. NK cells were stimulated with media, PMA, C-IgG or F-IgG coated KB tumor cells for 45 minutes and levels of phospho‐ERK were determined by flow cytometry (C) Flow cytometry analysis of CD56/CD69 populations of NK cells. . Dual positive CD56+/CD69+ cells represent activated NK cells. The mean fluorescence intensity (MFI) of CD69 on both CD56dim and CD56bright cells was also determined for media (71.5 vs 77.4 MFI), CIgG (71.9 vs 66.5 MFI) and FIgG (165 vs 303 MFI) treated cells (bottom). The lytic activity of purified NK cells against C-IgG– or F-IgG–coated (D) FR+ tumor cells (KB cells) or (E) FR– tumor cells (A549) was assessed in a standard 4-h chromium release assay: For KB targets, cytotoxic activity at all E:T ratios against F-IgG–coated cells differed significantly from C-IgG–coated KB cells, P < 0.0001, but A549 cells showed no significant differences. Results shown are representative of NK cells derived from n = 4 donors.

