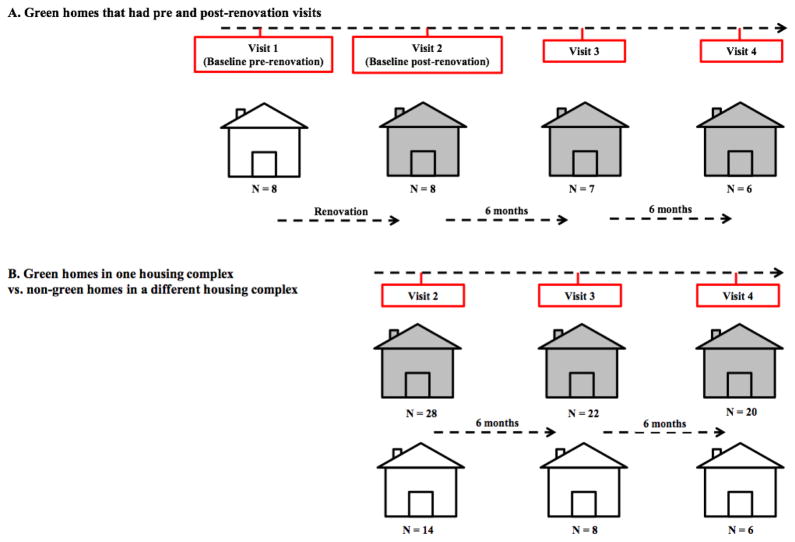
Figure 1.
Schematic of an overall timeline for the Cincinnati Green Housing Study (CGHS).
(A) Green homes (n=8) in the housing complex that had visits before and after renovation. White home indicates the pre-renovation visit.
(B) Green homes in one housing complex (n=28) vs. non-green homes in a different housing complex (n=14). Gray shading indicates green homes.

