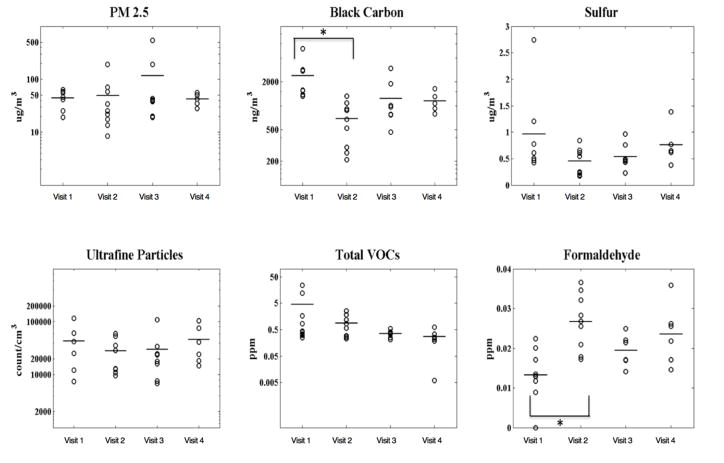
Figure 3.
Indoor concentrations of environmental pollutants in pre- and post-renovated homes presented in Figure 1A. Each symbol in the figure represents a single measurement. The data represent measurements conducted only in homes of families that stayed within the community pre- and post-renovation. The lines in the figure represent the medians. * represents statistically sigificant difference (p<0.05)

