Figure 1.
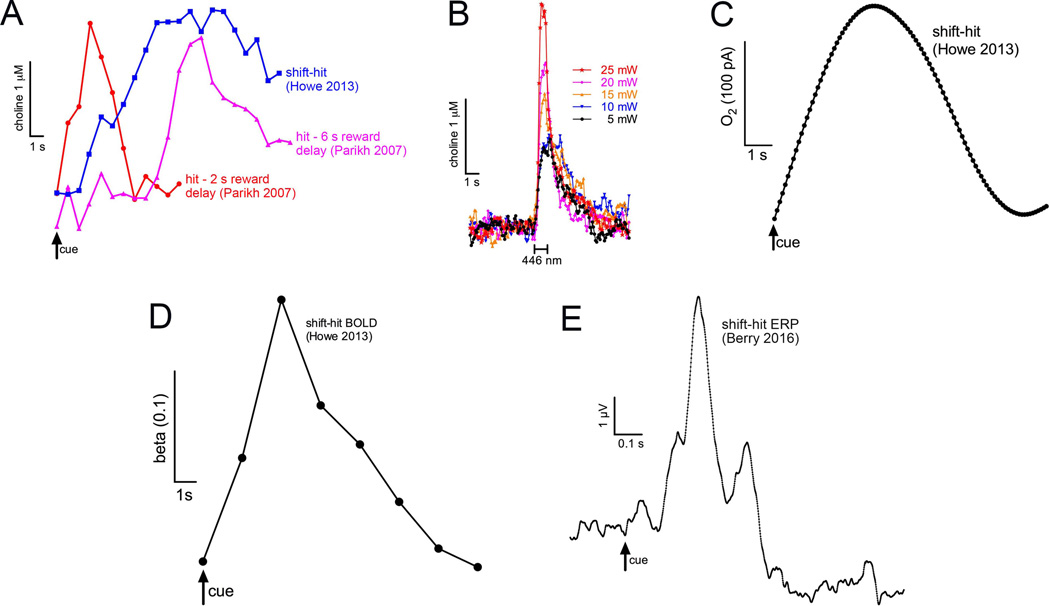
Shift-hit associated neurochemical (A,C), imaging- (D), and EEG-based (E) signals in rodents (A–C) and humans (D,E). A: Cholinergic transients recorded in rats performing a cued appetitive response task (Parikh et al., 2007) or a Sustained Attention Task (SAT; Howe et al., 2013). For the former, separate groups of rats were trained to retrieve reward 2 or 6 s (means) following the detection of the signal (red and pink trace, respectively). In the SAT reward was delivered as soon as the levers were extended (2 s after the signal) and the animals scored a hit (+640 ms) or latest at ~ 6.5 s (as levers remained available for 4 s). In all three cases, choline signal amplitudes peaked at around the learned reward delivery periods. As discussed in the main text, currents recorded during shift-hits in SAT performing rats were multiplied by 10 to scale with currents recorded in rats scoring hits in the cued appetitive response task. B: Cholinergic transients evoked by ChR2 stimulation using stimulation parameters that increased hits if stimulation occurred during cued trials, and false alarms if stimulation occurred during nonsignal trials (Gritton et al., 2016). Photoactivation stimulates ACh release in isolation which contrasts with endogenous release events that reflect the product of heterogeneous mechanisms and the interactions across multiple neuronal networks. This could explain why stimulation in isolation results in transients with faster rise and decay times and lower variability then endogenous transients (see main text). C: Oxygen levels in the right mPFC of rats performing shift-hits paralleled choline currents (Howe et al., 2013). As tissue oxygen levels serve as a proxy for fmri BOLD measures in rats, shift-hit associated BOLD signals in humans (D) are hypothesized to reflect in part cholinergic activity. D: Contrast between the right frontal (Brodmann area 10) fmri BOLD response during a shift-hit and a consecutive hit (Howe et al., 2013) E: Evoked response potential (ERP) for shift-hits. The trace depicts the group grand average waveform for frontal electrodes (Fz, AFz, FPz). The P300a peak approximately 290 ms following signal onset (arrow) was significantly larger for shift-hits relative to consecutive hits (Berry et al., 2016).

