
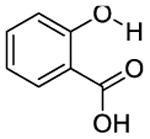
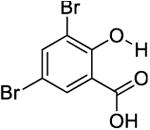
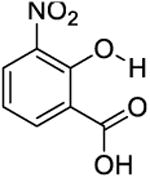
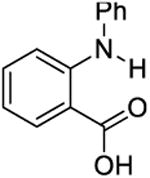
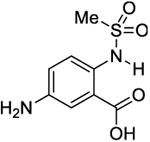
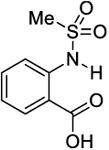
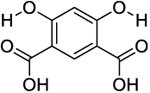
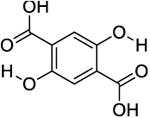
Table 1.
The chemical shift and the fitted exchange rates using UFZ-QUEST. Error bars indicate 95% confidence limits.
| Compound | Chemical Shift relative to water frequency, ppm | kex, S-1, this study | kex, S-1, previous study[13] | |
|---|---|---|---|---|
| 1 |
|
9.3 | 410 ± 80 | 410 ± 20 |
| 2 |
|
10.5 | 650 ± 100 | 550 ± 40 |
| 3 |
|
12 | 1600 ± 400 | 1400 ± 300 |
| 4 |
|
4.8 | 800 ± 200 | 700 ± 40 |
| 5 |
|
6.3 | 180 ± 60 | 540 ±30 |
| 6 |
|
7.3 | 200 ± 60 | 470 ±30 |
| 7 |
|
9.8 | 500 ± 100 | 460 ± 30 |
| 8 |
|
8.3 | 600 ± 150 | 980 ± 40 |