Abstract
The aim of this study was to determine the performance of a novel mobile human brain/small animal PET-CT system, developed by Photo Diagnostic Systems Inc. The scanner has a 35.7-cm diameter bore and a 22-cm axial extent. The detector ring has 7 modules each with 3×4 cerium-doped lutetium yttrium orthosilicate crystal blocks, each consisting of 22×22 outer layer and 21×21 inner layer crystals, each layer 1 cm thick. Light is collected by 12×12 SiPMs. The integrated CT can be used for attenuation correction and anatomical localization. The scanner was designed as a low-cost device that nevertheless produces high-quality PET images with the unique capability of battery-powered propulsion, enabling use in many settings.
Methods
Spatial resolution, sensitivity and noise-equivalent count rate (NECR) were measured based on the National Electrical Manufacturers Association NU2-2012 procedures. Reconstruction was done with tight energy and timing cuts: 400-650 keV and 7ns, and loose cuts: 350-700 keV and 10ns. Additional image quality measurements were made from phantoms, human, and animal studies. Performance was compared to a reference scanner (ECAT Exact HR+) with comparable imaging properties.
Results
The full-width half-max transverse resolution at 1 cm (10 cm) radius is 3.2 mm (5.2 mm radial, 3.1 mm tangential) and the axial resolution is 3.5 mm (4.0 mm). For tight (loose) cuts, a sensitivity of 7.5 (11.7) kcps/MBq at the center increases to 8.8 (13.9) kcps/MBq at a 10 cm radial offset. The maximum NECR of 19.5 (22.7) kcps was achieved for an activity concentration of 2.9 kBq/ml. Contrast recovery for 4:1 hot cylinder to warm background was 76% for the 25 mm diameter cylinder, but decreased with decreasing cylinder size. The quantitation agrees within 2% of the known activity distribution and concentration. Brain phantom and human scans have shown agreement in SUV values and image quality with the HR+.
Conclusion
We have characterized the performance of the NeuroPET/CT and shown images from the first human studies. The study shows that this scanner achieves good performance when considering spatial resolution, sensitivity, count rate, and image quality along with a low cost and unique mobile capabilities.
Keywords: PET/CT, instrumentation, NEMA standard
INTRODUCTION
Positron Emission Tomography (PET) has proved to be a powerful tool for diagnosis of dementia (1) and diagnosis and monitoring of brain tumors (2). It can also be used to measure responses to stimuli. Renewed interest in brain imaging is leading to the development of dedicated head scanners with a low cost while still maintaining high sensitivity and spatial resolution.
The NeuroPET/CT is a full-ring mobile brain PET-CT (computed tomography) scanner developed by Photo Diagnostic Systems, Inc. (PDSi) (3,4). It is the first ever dedicated brain PET-CT scanner. While developed primarily for brain imaging, it can also be used for animal and pediatric imaging. Because all PET data are acquired in list mode, it is easy to create dynamic reconstructions. The NeuroPET/CT is self-propelled on wheels powered by its battery, such that it can be driven to multiple locations. Due to its mobility and ability to use any standard power outlet, the NeuroPET/CT can be used in a flexible manner. Instead of a motorized bed moving through the bore, as with typical scanners, the NeuroPET/CT moves on treads to collect CT data, and can be used with any bed that can be adjusted to the appropriate height. A NeuroPET/CT scanner was installed at Massachusetts General Hospital (MGH) in 2011. After a period of studies on its performance, the scanner is now used for clinical and pre-clinical research studies. Figure 1 shows a picture of the scanner with major components labeled.
FIGURE 1.
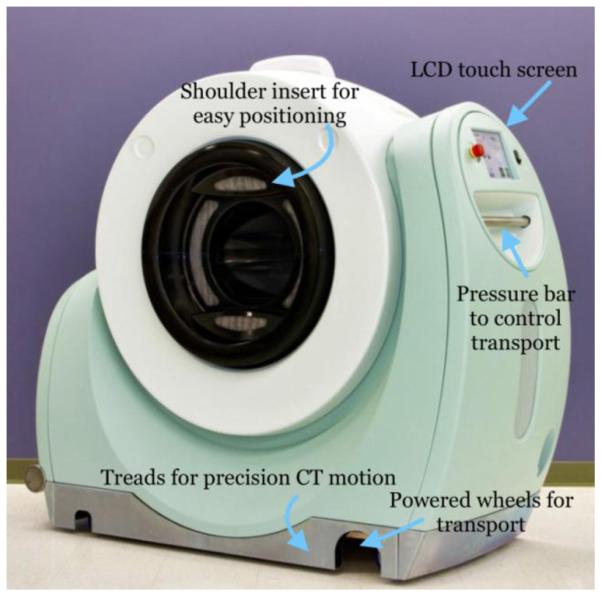
The NeuroPET/CT scanner with outer components labeled. Treads (behind the metal apron) are used for precise scanner motion during CT scans, while wheels are used to transport the scanner to the scan location.
We evaluated the imaging characteristics of the PET component of the NeuroPET/CT scanner using the National Electrical Manufacturers Association (NEMA) standards measurements (5), and with additional phantom, animal, and human studies.
MATERIALS AND METHODS
PET Specifications
NeuroPET/CT was designed to achieve high sensitivity and good spatial resolution. The PET detector consists of 1-cm long cerium-doped lutetium yttrium orthosilicate (LYSO) crystals divided into modules and blocks. The physical specifications of the NeuroPET/CT are summarized in Table 1, along with specifications for the ECAT Exact HR+ scanner, which is currently used at MGH for brain imaging. Event positions are determined using the centroid from the SiPM array on each block. While the two offset inner and outer crystal layers will eventually be used to determine the depth of interaction (DOI), they are currently treated as a single layer with a single characteristic conversion depth. The 22-cm axial extent of the PET rings allows the human brain to be imaged in a single acquisition.
TABLE 1.
Design characteristics of the NeuroPET/CT with the HR+ for comparison
| Characteristic | NeuroPET/CT value | HR+ value |
|---|---|---|
| Detector ring diameter | 35.7 cm | 82.4 cm |
| Detector material | LYSO:Ce | BGO |
| No. crystals | 77,700 | 18,432 |
| Modules | 7 | 32 rings |
| Blocks/module | 3 × 4 | |
| Crystal size | 2.3 × 2.3 × 10 mm (x 2 layers) |
4.05 × 4.39 × 30 mm |
| Crystal array/block | 22 × 22 outer, 21 × 21 inner | 16 crystals/pmt |
| Transaxial FOV | 25 cm | 58.3 cm |
| Axial FOV | 22 cm | 15.5 cm |
| Coincidence window | Online 10.14ns (7ns offline) | 12 ns |
| Energy window (keV) | Variable, default: 400-650 | 300-650 |
PET data are taken in list mode and the reconstruction software creates sinograms with randoms, scatter, and attenuation corrections for multiple temporal frames. A dead time correction is applied based on a paralyzable dead time model at the block level. Singles rates for each block are collected every 6 seconds during an acquisition and used in the dead time correction. Delayed data used for the randoms correction have offline cuts and live fraction applied before sinogram binning. Smoothing is applied prior to subtraction from the prompts. Radioactive decay is corrected on a per-frame basis. For scatter correction, the standard "single scatter simulation" method (6) is used. To correct for inhomogeneity and variations in the coincidence channels (i.e., lines of response), a two hour normalization scan is taken of a thin (low scatter) uniform 30.5 cm long annulus with inner (outer) diameter of 27.9 cm (29.2 cm) filled with ~18 MBq of 18F. The data are binned into sinograms and randoms are subtracted. Normalization data are corrected for differences in the activity distribution and are variance reduced before being used as a normalization correction in the reconstruction. Attenuation correction is done using a low-dose CT scan taken with each PET scan. The bilinear scaling method is used to convert CT images in HU to μ-values at 511 keV (7,8).
Iterative maximum likelihood expectation-maximum (MLEM), and filtered back projection (FBP) are reconstruction options. Reconstructions are done in 2-D after Fourier rebinning (9). The projection operator is a line integral calculated on the fly, where the integrand is determined by performing a bi-linear interpolation in image space at fixed intervals along the line. The reconstruction uses a maximum ring difference that is half of the axial FOV. The hardware coincidence time window is 10 ns, but can be reduced as desired in the software. Similarly the energy window can be set to anywhere between 350 keV and 750 keV. Within this paper, “tight cuts” refers to an energy window of 400-650 keV and timing window of 7ns. “Loose cuts” refers to an energy window of 350-700 keV and timing window of 10 ns. The reconstructions in this paper use 256×256×92 image space bins for 1×1×2.3 mm3 voxels or 256×256×184 image space bins for 1×1×1.17 mm3 voxels. Images are calibrated to radioactivity concentrations in Bq/ml using a 6L cylindrical head-sized source of known activity concentration.
CT Specification and Safety Assessment
The CT has 3264 detector channels with 8 axial slices at spacing of about 1.25 mm. The X-ray source, capable of 100, 120, or 140 kVp at 2.0 to 7.0 mA, can rotate at 60 rpm for 1440 views/sec. The system is capable of taking full axial field-of-view helical CTs in under 15 seconds. Low dose AC CT scans deliver a dose of less than 100 mrem.
The limiting factor for the mobility of the NeuroPET/CT is the external radiation produced during CT operation. Scatter dose rates were measured with a 20 cm diameter, 27 cm length cylindrical water phantom at CT isocenter. Rates were measured for low dose AC CT scans (2 mA tube current), and higher dose, higher quality, CT scans (7 mA). All scans were 220 mm axial scans at 120 kVp, with 2-second resolution. At 1.5 m from the scanner and at 1.2 m height, the maximum dose received at a 45 degrees angle from patient axis is 308 (1076) μrem for a low (high) dose scan. The worst-case exposure at 3 m, with the scanner running at the highest dose settings, is 140 (470) μrem.
PET Performance
Initial performance measurements were based on the procedures prescribed in the NEMA NU 2-2012 standard.
Spatial Resolution
The spatial resolution was measured using three plastic-encased 5 µCi 22Na point sources less than 1 mm in all dimensions. The point sources were placed at two axial positions, the center of the FOV and 8.5 cm from the center, and scanned for 15 minutes each. For each axial location, the sources were placed at three (x,y) positions: (1 cm, 0), (0, 10 cm), and (10 cm, 0). The data were reconstructed using FBP with 1×1×1.17 mm3 voxel size, tight cuts, and no spatial smoothing. A parabolic fit was used to find the peak and then linear interpolation was used to find the full width at half maximum (FWHM) and the full width at tenth maximum (FWTM) of the point spread functions in all three cardinal directions, which were then combined into radial, transverse, and axial results.
Sensitivity
Sensitivity was measured with a standard set of thin aluminum sleeves around a 70-cm line source filled with 6.81 MBq at the start of acquisition, resulting in negligible dead time. The line source was placed in the center of the transverse FOV, parallel to the scanner bore. Five aluminum sleeves with increasing inner diameter and constant wall thickness were added to the line source, and a 180 second acquisition was taken for each additional sleeve. Sinograms were corrected for decay and randoms and data were single slice rebinned. The sensitivity was calculated as the normalized sum of the corrected activity for each acquisition. Counting rates were plotted against accumulated aluminum thickness. The absolute sensitivity was then obtained by extrapolating the data to zero thickness (no attenuation) using linear regression. The analysis was performed with both tight and loose cuts. The procedure was repeated, but with the setup at 5 cm and then at 10 cm from the center of the FOV.
Noise Equivalent Count Rate
The noise equivalent count rate (NECR) is the ratio of the square of the true rate to the total rate (true + random + scatter): NECR = T2 / (T+R+S). It is proportional to the square of the signal-to-noise ratio (SNR) in the reconstructed images. A 20-cm-diameter solid polyethylene scatter cylinder (ρ=0.96 g/cm3) with a length of 70 cm was used. A plastic tube was placed through the full length of the cylinder at 4.5 cm from the center and filled with 173 MBq 18F at the scan start. The cylinder was centered axially and transaxially in the scanner with the line source closest to the table.
The data were acquired over a 24-hour period as 20 frames of increasing length, from 79 seconds to one hour, each separated by 45 minutes. A “blank” scan was taken 44 hours later, with the phantom in place but no remaining activity, to measure the intrinsic rate. Sinograms were created for each frame using both tight and loose cuts. The sinograms were analyzed according to the NEMA instructions and noise equivalent count event rates were calculated for each acquisition.
Scatter Fraction
The scatter fraction was calculated with NECR data based on the methods described by Watson et al. (10). For each activity concentration, i, the scatter fraction, SF, was calculated according to the equation SFi=Rscatter/(Rtrue+Rscatter), where Rscatter was calculated by subtracting the delayeds estimated random event rate Rr, the trues rate Rtrue, and the intrinsics trues rate Ri (measured from the “blank” scan) from the total rate calculated within a 12 cm radius.
Dead Time Correction
The NECR measurement data was used to assess the dead time correction by comparing the system singles rate with and without dead time corrections versus activity concentration.
Image Quality and Quantitation
Uniform phantoms
A uniform cylindrical water phantom of volume 6,283 ml was filled with 20 MBq of 18F and scanned for 15 minutes. The data were reconstructed with tight cuts. An aliquot was used to measure the activity concentration with a well counter to compare to the image concentration. Images were examined for uniformity in axial and transaxial directions.
A contiguous grid of 10×10 mm2 ROI, all contained within a circle of radius 88 mm, was created for each slice. As a measure of concentration variability a coefficient of variation (COV) was determined by calculating the standard deviation of counts in the ROI, normalized by the mean of all ROI within each slice.
ACR Phantom
An American College of Radiology (ACR) accreditation phantom, with a section of wedges of cold rods of varying sizes (4.8, 6.4, 7.9, 9.5, 11.1, and 12.7 mm), a uniform section, and a section with cold and hot cylinders, was filled with 18F such that the hot cylinders to background ratio was 4:1. The total activity of about 13 MBq corresponds to that expected from a 222 MBq injection to a 70 kg patient. The phantom was scanned for 15 minutes, and reconstructed with tight cuts. The cold and hot cylinders were compared to the background activity to measure contrast recovery. The same phantom, fill, and scan parameters were performed on the HR+ and the data were reconstructed using standard brain imaging settings (described below), but without the usual segmenting of the attenuation map, to avoid artifacts from over-correction of air pockets.
The contrast recovery coefficients for the hot cylinders were calculated as CRC = (H/B-1)/(a-1) where H is the mean hot concentration in a single slice ROI with diameter corresponding to each cylinder diameter, B is the background concentration estimated from 60 ROI of the same size as the corresponding cylinder, and a is the true hot to background ratio. The cold cylinders’ recovery coefficients were calculated as (B-C)/B where C was the mean cold cylinder concentration.
Hoffman Brain Phantom
18F-FDG was added to a water-filled Hoffman 3-D brain phantom that was then shaken for several minutes and allowed to mix for another two hours. A 15-minute PET scan on the NeuroPET/CT was started when the phantom reached an activity of 27 MBq, slightly lower than the typical activity present during an FDG scan. The same procedure was later repeated on the HR+. Both the HR+ and the NeuroPET/CT images were reconstructed with the same respective parameters as for typical brain studies (see below). For comparison purposes, the NeuroPET/CT images were rigidly registered to the HR+ images by minimizing the least squares difference in the image intensities.
Human Scans
Over 50 human subjects have been scanned using the NeuroPET/CT at MGH. Each subject was injected with 190 ± 10 MBq of FDG. After 47 ± 6 minutes of uptake, the subject was scanned first on an HR+ for 15 minutes, and then 14 ± 6 minutes later on the NeuroPET/CT for a 15-minute PET. All human studies were approved by the MGH institutional review board and written informed consent was obtained.
The HR+ images were reconstructed as a single frame using the standard brain imaging settings: ordered subset expectation maximum (OSEM) algorithm with 3 iterations, 16 subsets, and 2 mm Gaussian smoothing, and voxel size 2×2×2.4 mm. The NeuroPET/CT images were reconstructed with MLEM, 100 iterations, 1.25 mm inter-iteration Gaussian smoothing and 1.85 mm Gaussian post-smoothing, voxel size 1×1×2.3 mm3 and the tight set of cuts.
Thirty-three subjects scanned on the NeuroPET/CT and the HR+, and who also had an MR scan, were selected for analysis. FDG-PET image volumes were registered to each subject’s MR image volume using the rigid-body registration algorithms in the Statistical Parametric Mapping (SPM) software (11). The MR volume was then registered to the ICBM-152 MNI brain template (12) using non-linear SPM registration. The resulting registration matrix was used to transform the two corresponding PET image volumes. Using the MNI structural atlas, the average Standardized Uptake Value (SUV) within each of 9 anatomical regions (caudate nucleus, cerebellum, frontal lobe, insular cortex, occipital lobe, parietal lobe, putamen, temporal lobe, and thalamus) was computed for each subject. A scatter plot to show the relationship between the measured SUVs on the HR+ and NeuroPET/CT was made for all 9 regions and all 33 subjects. To establish the basic linear relation between SUVs measured on these scanners, the within-patient SUVs from the two scanners were fitted to the linear model with blocked total least squares regression (TLS) (13)
where subscript i denotes subject and subscript j denotes region. This analysis yields a mutual regression slope, k, for all subjects and an intercept, Ci for each subject that accounts for subject-specific uptake and clearance rates.
Animal Scan. In addition to the human brain studies, a low dose 11C kinase tracer study was performed on a macaque monkey. The monkey was injected with 250 μCi at the start of PET acquisition, scanned for 15 minutes, and images were reconstructed using the tight cuts with 1×1×1.17 mm3 voxels. The MGH animal care committee approved all animal studies.
RESULTS
Spatial Resolution
The spatial resolution for each of the point source measurements is listed in Table 2 along with literature-based values for the HR+ (14,15). The values for the HR+ were also from FBP reconstructions and used the same analysis method.
TABLE 2.
NeuroPET/CT (NP) and HR+ spatial resolutions from point sources
| Full width half/tenth max | Radial position: r = 1 cm | Radial position: r = 10 cm | |||
|---|---|---|---|---|---|
|
|
|||||
| (mm) | Transverse | Axial | Radial | Tangential | Axial |
| FWHM NP | 3.2 | 3.5 | 5.2 | 3.1 | 4.0 |
| FWHM HR+ | 4.5 | 5.1 | 6.8 | 4.8 | 6.2 |
| FWTM NP | 6.0 | 6.8 | 8.3 | 5.5 | 8.3 |
| FWTM HR+ | 8.2 | 11.2 | 12.2 | 9.9 | 13.5 |
Sensitivity
For the NEMA sensitivity measurement, Figure 2 shows the results of the sensitivity as a function of accumulated sleeve thickness for the NeuroPET/CT and the sensitivity of the HR+. The center of the FOV has a sensitivity of almost 0.75% (i.e., 7.5kcps/MBq), increasing to 0.88% at a 10 cm offset. With the looser energy and timing windows, the sensitivity increased to 1.16% (1.39%) at the center (radial) placement. The sensitivity of the HR+ is much smaller—0.66% central and 0.72% at 10 cm offset.
FIGURE 2.
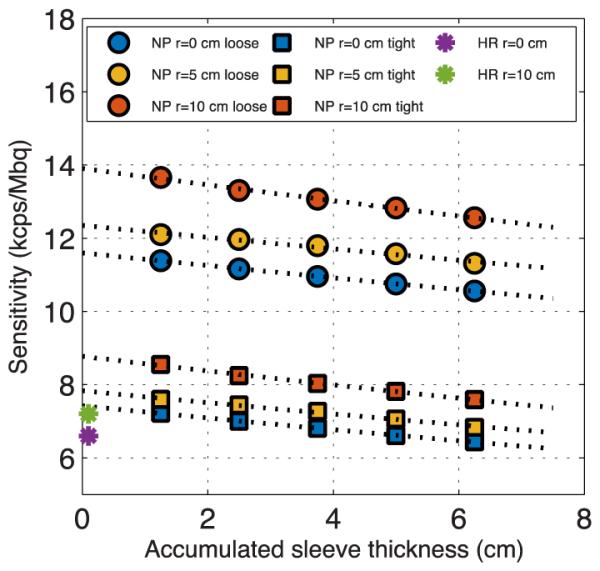
Sensitivity as a function of sleeve thickness for three different radial placements on the NeuroPET/CT. Loose cuts are shown with circles, tight cuts with squares. The lower HR+ sensitivity is shown for reference.
NECR
Figure 3 shows the NECR versus activity concentration. With tight cuts, the maximum NECR of 19.5 kcps was achieved for an activity concentration of 2.9 kBq/ml. With the loose cuts, the peak NECR was 22.7 kcps.
FIGURE 3.
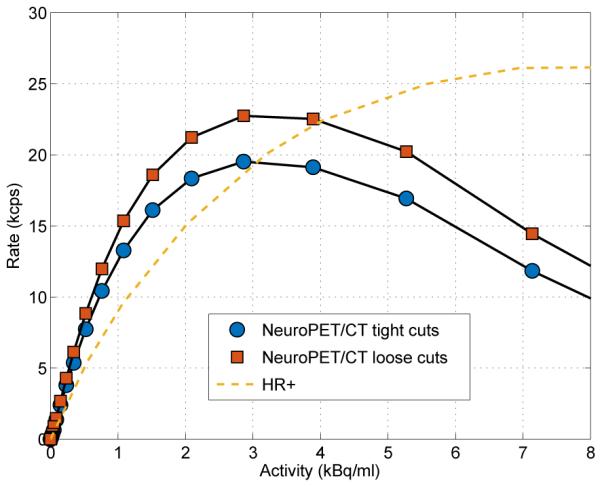
The noise equivalent count rate versus activity concentration for the NeuroPET/CT with tight and loose cuts, and for the ECAT HR+.
Scatter Fraction
The mean scatter fraction (SF) at peak NECR was 42.7% for the tight cuts, and 44.4% for the loose cuts. This SF is slightly lower than the 46.9% measured for the HR+ (15).
Dead Time Correction
An extrapolation from a linear fit to the system singles at low count rate was used as an ideal case with no dead time. Relative to the extrapolated fit, the singles rate is under-corrected by 2.4% at peak NECR and at the typical human FDG singles rates, increasing to 5% at a rate of 40 Mcps and activity concentration of 7.1 kBq/ml.
Image Quality and Quantitation
Uniformity phantoms
The 18F activity concentration measured in a 4233 ml ROI in the image was about 2% higher than the well counter measurements. There is a slight decrease of the activity distribution towards the edges of the phantom. The COV from the grid of ROI had mean and standard deviation across the slices of 7.4±1.1%.
ACR phantom
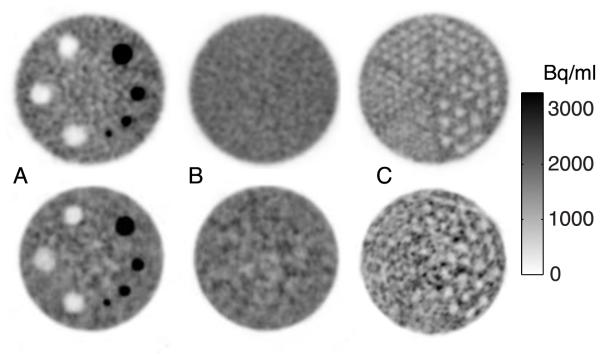
Figure 4 shows (A) a transverse view of the hot and cold cylinders, (B) the uniform section, and (C) the resolution using cold rods in a warm background. Rods in five of the six wedges are resolved. Contrast recovery results are in Table 3.
FIGURE 4.
NeuroPET/CT (top) and HR+ (bottom) ACR-type phantom showing 10 mm transverse slices of the (A) contrast section with cold and hot cylinders (B) uniform section and (C) cold rod section for resolution, with the second smallest (6.4 mm) rods resolved for the NeuroPET/CT and the third largest (9.5 mm) rods resolved for the HR+, although lower resolution in the HR+ could be due to the proximity to the edge of the axial FOV. ACR: American College of Radiology
TABLE 3.
Contrast recovery coefficients (CRC) for hot and cold vials in the ACR phantom
| Cylinder diameter | 8 mm | 12 mm | 16 mm | 25 mm | H2O | Air | Bone |
|---|---|---|---|---|---|---|---|
| CRC NeuroPET/CT | 0.32 | 0.50 | 0.66 | 0.76 | 0.80 | 0.80 | 0.90 |
| CRC HR+ | 0.44 | 0.61 | 0.61 | 0.73 | 0.67 | 0.63 | 0.72 |
Hoffman Phantom
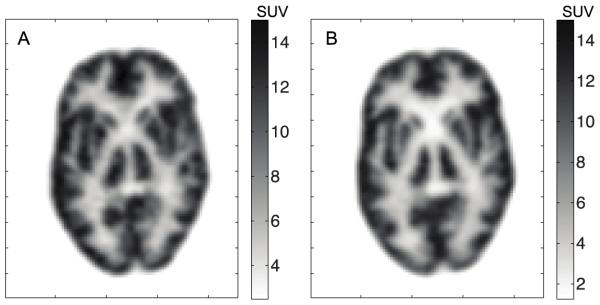
Images of the Hoffman phantom from the NeuroPET/CT scan show well-resolved structures and are visually comparable to those of the HR+. Given the differences in reconstruction algorithms, and the need for registration, it is difficult to say that either outperforms the other. Figure 5 shows a slice of the phantom from each scanner.
FIGURE 5.
Transverse slice from Hoffman phantom for the (A) NeuroPET/CT and (B) HR+. Standardized uptake value (SUV) is based on 70 kg patient.
Human Studies
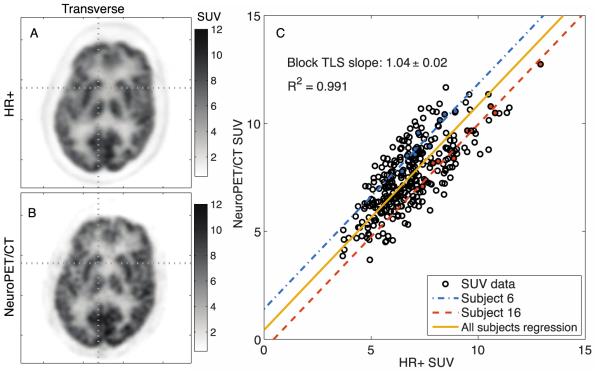
Human brain images on the NeuroPET/CT were overall of better quality, by visual inspection, than those of the HR+, despite a slightly lower activity concentration. Features of the gray matter are more distinct on the NeuroPET/CT images, although there is slightly more scatter into the white matter regions. An example human brain image with 1×1×1.17 mm3 voxels is shown in Figure 6(A) for the HR+ and 6(B) for the NeuroPET/CT. Figure 6(C) shows 33 subjects with a global TLS fit and two example subjects highlighted. The mutual TLS regression slope of 1.04 ± 0.02 is close to 1 with an R2 also close to 1, suggesting that data obtained on the NeuroPET/CT are equivalent to those obtained with the HR+. We found that the data could be described with a single regression slope and an offset adjusted for individual subject and scan conditions.
FIGURE 6.
FDG images for an example subject scanned in (A) the HR+ and (B) the NeuroPET/CT, which show comparable visual quality. (C) The comparison between HR+ and NeuroPET/CT SUV of 9 regions in 33 subjects using blocked total least squares regression. Two example subjects are shown in blue and red while the averaged intercept was used for the yellow regression line. FDG: Fluorodeoxyglucose. SUV: Standardized uptake value.
Animal scan
PET/CT fused images of the monkey brain are shown in Figure 7, to demonstrate the capability of the scanner at very low activity levels. Features of the monkey brain are clearly visible in the PET tracer distribution.
FIGURE 7.
Transverse, coronal, and sagittal PET/CT views of a monkey brain scanned for 15 minutes after injection of 250 μCi of a 11C kinase tracer that is under development.
DISCUSSION
The results presented above summarize the imaging capabilities of the NeuroPET/CT, with comparisons to the ECAT HR+. Many of the procedures followed were based on NEMA standards for a full body scanner. As such, we did expect some differences in objective results given that the NeuroPET/CT is a head scanner being compared to the full body HR+ scanner. Partly for this reason we also included the results of the human brain studies.
Spatial Resolution
Compared to the HR+ the NeuroPET/CT has superior resolution for all point source measurements. The spatial resolution away from the center of the scanner suffers somewhat due to the small ring size. While the smaller ring provides an advantage in sensitivity over the full-body sized HR+, it also creates additional uncertainty in the interaction position along the crystal. This disadvantage could be mitigated in the future by using depth of interaction information.
Sensitivity
The NEMA sensitivity is about 1.2 times of that for HR+ for tight cuts, and 1.8 times for loose cuts (which are more similar to the HR+ settings). This higher sensitivity is because NeuroPET/CT has large solid angle and smaller gaps between the neighboring modules. The rate was normalized to the full line source of 70 cm. If instead it is normalized to the length of the axial field, 22 cm, then the sensitivity calculation increases by a factor of 3.2, as noted in previous performance studies of head scanners (16).
NECR
The NECR curve for the NeuroPET/CT peaks at a fairly low activity concentration, but in that region its NECR is 5-20% higher (depending on the cuts used) than the HR+ NECR. The point of peak NECR corresponds to 63 MBq in the line source. Assuming about 1/3 is in the FOV that corresponds to 19.6 MBq. While it is somewhat lower than the activity level in a typical FDG scan (~28 MBq), it is not far outside clinical parameters, especially for longer scans. The high NECR at lower activities for the NeuroPET/CT indicates that lower doses can often be used without sacrificing imaging quality in terms of SNR.
Image Quality and Quantitation
Image quality and quantitation are suitable for the intended use of the NeuroPET/CT. The contrast recovery is comparable to that of the HR+—slightly better for the larger cylinders, and slightly worse for the smaller cylinders. There is a high correspondence of SUV values within subjects measured with the HR+ and NeuroPET/CT. Some differences between the human images from the two scanners are expected, given the uncertainties from differences in FDG bio-distribution, scan time, and registration warping.
CONCLUSION
The device tested is the first mobile brain PET-CT scanner. In this work, we characterized the performance of the NeuroPET/CT scanner based on NEMA, phantom, and human studies. Our study shows that the scanner has achieved a good combination of performance in terms of spatial resolution, sensitivity, count rate, and image quality, with the added advantage of mobility and flexibility of use.
ACKNOWLEDGMENTS
We would like to thank Zakhar Levin and Steve Weise at MGH for their help with phantom and human studies.
Financial Support: NIH Grants S10RR028110, T32EB013180, R21EB012823, R01EB019959, C06CA059267.
DISCLOSURE
Terrence Toole is an employee of PDSi. This work was supported by NIH Grants S10RR028110, T32EB013180, R21EB012823, R01EB019959, C06CA059267.
REFERENCES
- Ishii K. PET approaches for diagnosis of dementia. Am J Neuroradiol. 2014;35:2030–2038. doi: 10.3174/ajnr.A3695. [DOI] [PMC free article] [PubMed] [Google Scholar]
- Basu S, Alavi A. Molecular imaging (PET) of brain tumors. Neuroimaging Clin N Am. 2009;19:625–646. doi: 10.1016/j.nic.2009.08.012. [DOI] [PubMed] [Google Scholar]
- Ouyang J, Keeler M, Bonab A, Zhu X, Brady T, El Fakhri G. Performance measurements of a novel mobile NeuroPET-CT. Soc Nucl Med Annu Meet Abstr. 2012;53(suppl 1):435. [Google Scholar]
- Ouyang J, Toole T, Keeler M, et al. Performance comparison between NeuroPET-CT and Siemens ECAT HR+: NEMA and patient studies. Soc Nucl Med Annu Meet Abstr. 2014;55(suppl 1):2162. [Google Scholar]
- National Electrical Manufacturers Association . Performance Measurement of Positron Emission Tomographs. National Electrical Manufacturers Association; Rosslyn, VA: 2012. NEMA Standards Publication NU 2-2012. [Google Scholar]
- Watson CC. New, faster, image-based scatter correction for 3-D PET. IEEE Trans Nucl Sci. 2000;47:1587–1594. [Google Scholar]
- Bai C, L S, AJ DS, Zhao Z. A generalized model for the conversion from ct numbers to linear attenuation coefficients. IEEE Trans Nucl Sci. 2003;50:1510–1515. [Google Scholar]
- Burger C, Goerres G, Schoenes S, Buck A, Lonn AHR, Von Schulthess GK. PET attenuation coefficients from CT images: experimental evaluation of the transformation of CT into PET 511-keV attenuation coefficients. Eur J Nucl Med Mol Imaging. 2002;29:922–927. doi: 10.1007/s00259-002-0796-3. [DOI] [PubMed] [Google Scholar]
- Defrise M, Kinahan PE, Townsend DW, Michel C, Sibomana M, Newport DF. Exact and approximate rebinning algorithms for 3-D PET data. IEEE Trans Med Imaging. 1997;16:145–158. doi: 10.1109/42.563660. [DOI] [PubMed] [Google Scholar]
- Watson CC, Casey ME, Eriksson L, Mulnix T, Adams D, Bendriem B. NEMA NU 2 performance tests for scanners with intrinsic radioactivity. J Nucl Med. 2004;45:822–826. [PubMed] [Google Scholar]
- Friston KJ, Holmes AP, Worsley KJ, Poline J-P, Frith CD, Frackowiak RSJ. Statistical parametric maps in functional imaging: A general linear approach. Hum Brain Mapp. 1994;2:189–210. [Google Scholar]
- Grabner G, Janke AL, Budge MM, Smith D, Pruessner J, Collins DL. Symmetric atlasing and model based segmentation: an application to the hippocampus in older adults. Med Image Comput Comput Assist Interv. 2006;9:58–66. doi: 10.1007/11866763_8. [DOI] [PubMed] [Google Scholar]
- Deming WE. Statistical Adjustment of Data. Dover Publications; New York: 1964. [Google Scholar]
- Adam LE, Zaers J, Ostertag H, Trojan H, Bellemann ME, Brix G. Performance evaluation of the whole-body PET scanner ECAT EXACT HR+ following the IEC standard. IEEE Trans Nucl Sci. 1997;44:1172–1179. [Google Scholar]
- Karakatsanis N, Sakellios N, Tsantilas NX, et al. Comparative evaluation of two commercial PET scanners, ECAT EXACT HR+ and Biograph 2, using GATE. Nucl Instruments Methods Phys Res Sect A Accel Spectrometers, Detect Assoc Equip. 2006;569:368–372. [Google Scholar]
- Karp JS, Surti S, Daube-Witherspoon ME, et al. Performance of a brain PET camera based on anger-logic gadolinium oxyorthosilicate detectors. J Nucl Med. 2003;44:1340–1349. [PubMed] [Google Scholar]


